Benefits of production analyses
A typical scenario from production
Automated assembly and testing systems are highly complex systems. They combine precise mechanics with intelligent controls to assemble and test components quickly and without errors. As a rule, special machines are used here that are planned and operated for the entire life cycle of the car, for example in the automotive industry.
In practice, companies are often faced with the challenge of performance and quality deviations occurring even after the (already complicated) commissioning phase. Their causes are often difficult to identify and, in addition, problems often do not occur on a regular basis, but instead exhibit patterns that are initially invisible to the naked eye.
For example, there are often individual stations where the cycle time varies - or test results, for example from leak tests, that fluctuate unexpectedly and ultimately lead to rework. The system usually knows that the component is not in order and rejects it. But the question then becomes: Is it the product, the machine, the tool or the ambient conditions?
Example
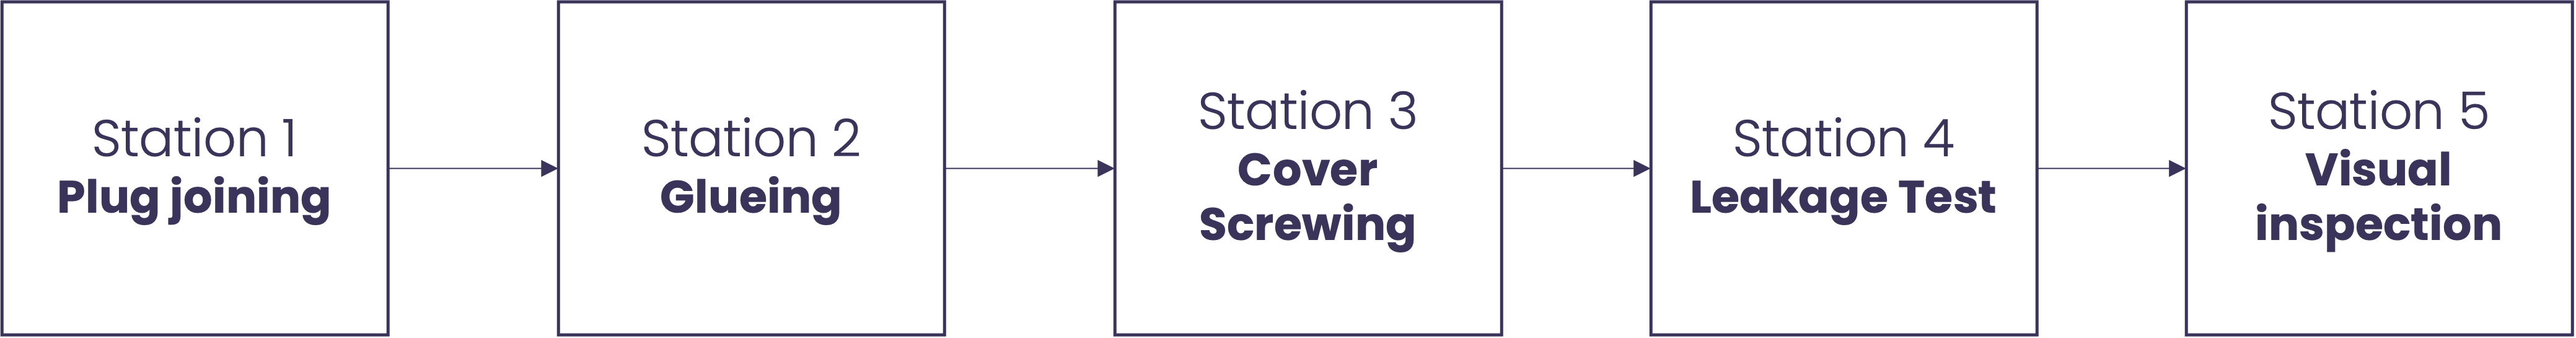
In this example, we look at a typical production line used in the automotive industry. The example system is an automated line consisting of several stations, each of which performs different tasks. The line combines various production steps, a joining process, a gluing process and a screwing process. This is followed by two test stations that check the quality of the finished components. In this case, the tests consist of a leak test and another camera-based visual inspection.
In order to achieve correct control of the processes, each station is equipped with a large number of sensors that record data on the process parameters, such as torque, force, leakage value and temperature. This data is transmitted to the system's control unit in real time and processed there.
Processed components are provided with a status at each station, which indicates whether the component is OK. (in order), n.i.O. (not OK) or requires reworking. The status information is usually generated automatically by the control system and is available for each station and each processing step.
At the same time, process parameters are recorded for each process, which are recorded for the respective component at the end of the process. In addition to the process parameters, we also have sensor data such as live positions, live forces, temperatures or vibration values, which are often recorded in high resolution for the duration of the machining process.
The challenge is to use this data to identify and eliminate the causes of performance and quality deviations. Although the data is available, it is generally not processed in such a way that it can be used directly for analysis.
Data as a remedy
If we divide the above-mentioned data into categories, this results in the following data types:
- Sensor data such as live positions, live forces, temperatures or vibration values, which are often recorded in high resolution for the duration of the machining process. often recorded in high resolution for the duration of the machining process.
- Process parameters e.g. torques, leakage values or force values, which are recorded at the end of a process for the respective component. component at the end of a process.
- Status information, which the system usually assigns automatically to each component and which contains information about whether it was OK, not OK or reworked. Status information is not only available for the entire process, but also for each station and each processing step.
- Component information such as serial numbers and variants for assigning the above-mentioned data.
- Further data, e.g. on tools used, workpiece carriers or material properties that are relevant for the process execution. relevant for the process execution.
The benefits of simple analyses
Looking at this data, the first analyses and key figures are obvious, helping process engineers to continuously improve the system.
- Which assemblies frequently cause problems?
- Are certain workpiece carriers responsible for rejects?
- Are there trends in leakage values that will generate rejects in the near future?
- Do certain combinations of tools cause deviations in cycle time?
- How stable are certain tightening processes?
- Are there unusual force-displacement curves that cause rework?
From an analysis perspective, many of these questions are actually easy to answer.
Rule-based evaluations and threshold value monitoring are sufficient for initial results, and very simple evaluations (e.g. evaluations by assembly) are sometimes even already available in the MES. Trend analyses or anomalies on curves, on the other hand, require higher-resolution data and temporal observations in order to avoid false alarms.
Challenges in data collection
Unfortunately, the controller does not give us the necessary data directly. If the data is obtained directly from the PLC, we receive the current values from the controller for each discrete point in time that we query. Which data is written to the controller register at which point in time therefore depends on how the system is programmed (and often also on who programmed it).
If we are looking at a screwdriving process, for example, it may well be that individual process parameters are written at different times and then deleted again. It is therefore not enough to rely on a single query to record all relevant parameters. Instead, the relevant data between the start and end of the process must be found, filtered out and calculated.
Bytefabrik Production Analysis
The system analysis, a component integrated into the Bytefabrik Manufacturing Insights module, makes this process simple and invisible to the user. Once users have defined the relevant raw data and process parameters, the component, which runs in the background, recognizes each machining step and each process, records the start and end and extracts all relevant key figures and process parameters fully automatically.
The underlying technology is so flexible that it can be configured for a wide range of processes (even for non-discrete manufacturing). In just a few steps, all relevant views are available to really get to the bottom of problems with rejects and rework, and trends that could lead to quality or performance problems in the future are identified at an early stage.
Here are three examples of the many evaluations that are possible with the system analysis:
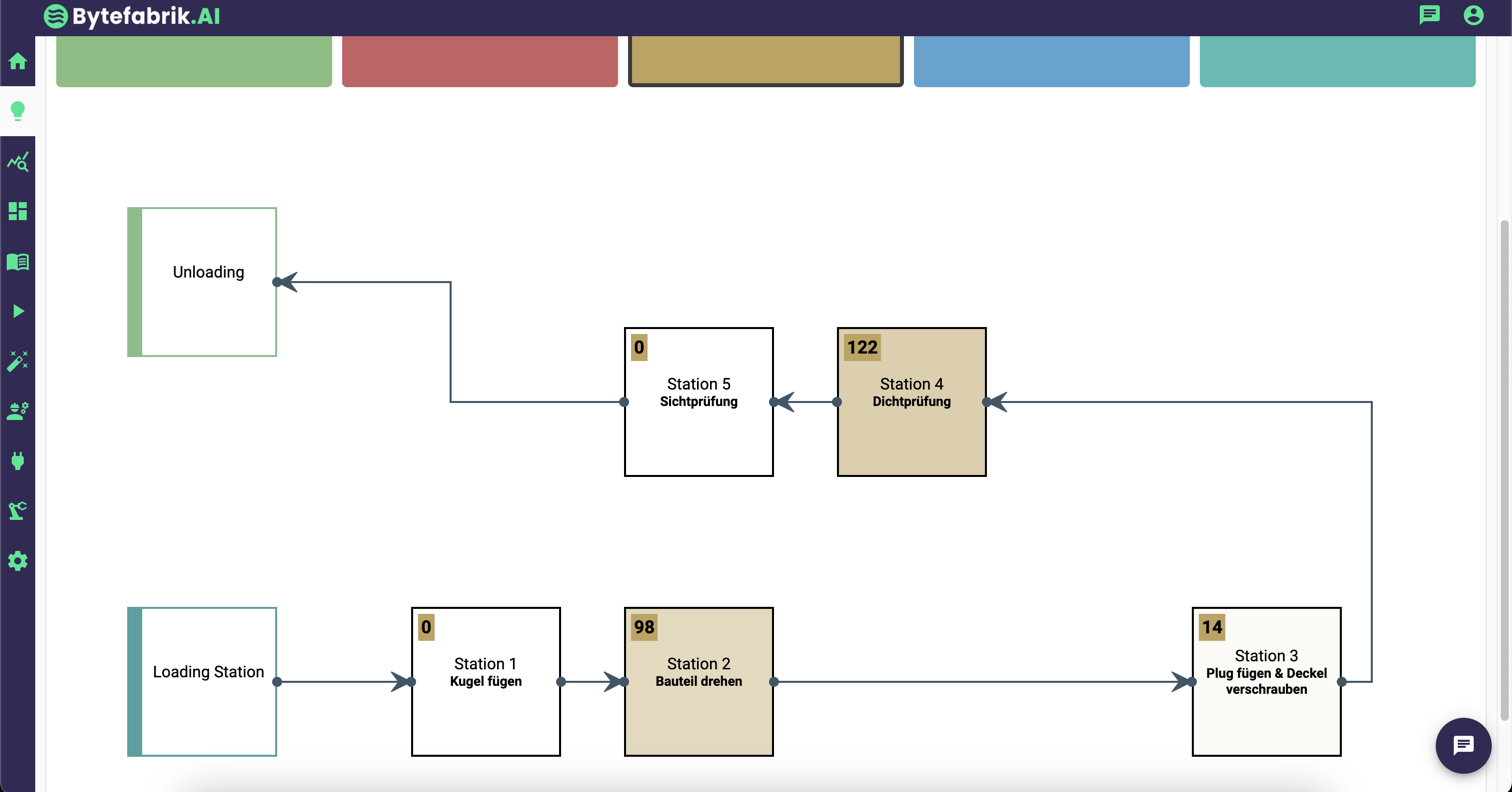
The first example shows an overview of all stations and their status. You can see at a glance which station is currently causing the most problems, such as the stability of scrap and rework rates as well as cycle and cycle times. This is the first basis for identifying “hotspots” and finding the causes of problems.
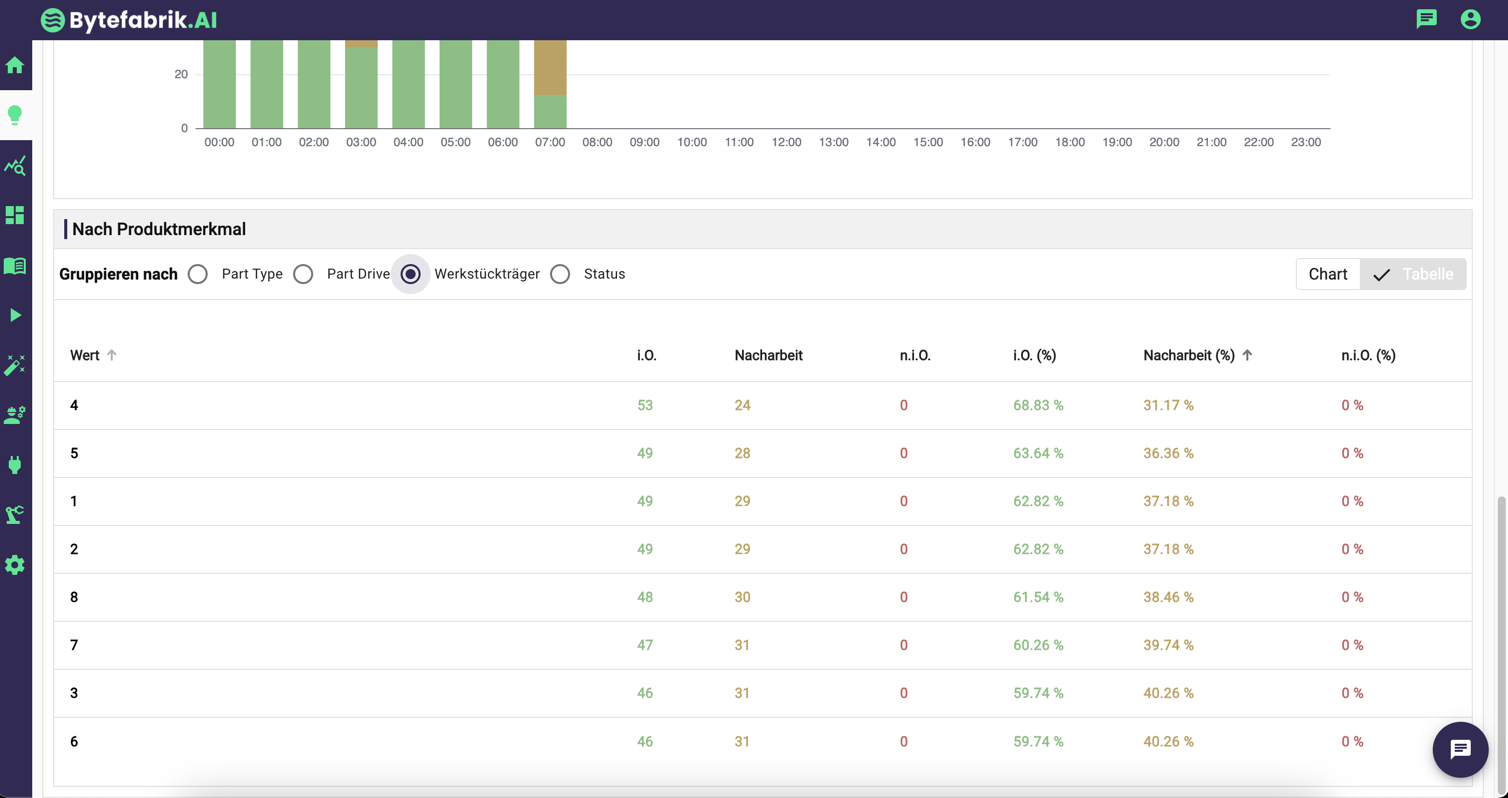
The second example shows an overview of all workpiece carriers and their status. At a glance (either as a table or as a clear diagram), you can see which workpiece carriers are currently causing the most problems and how the individual workpiece carriers compare. Similar evaluations can be created for all dimensions, for example assemblies, variants or tools.
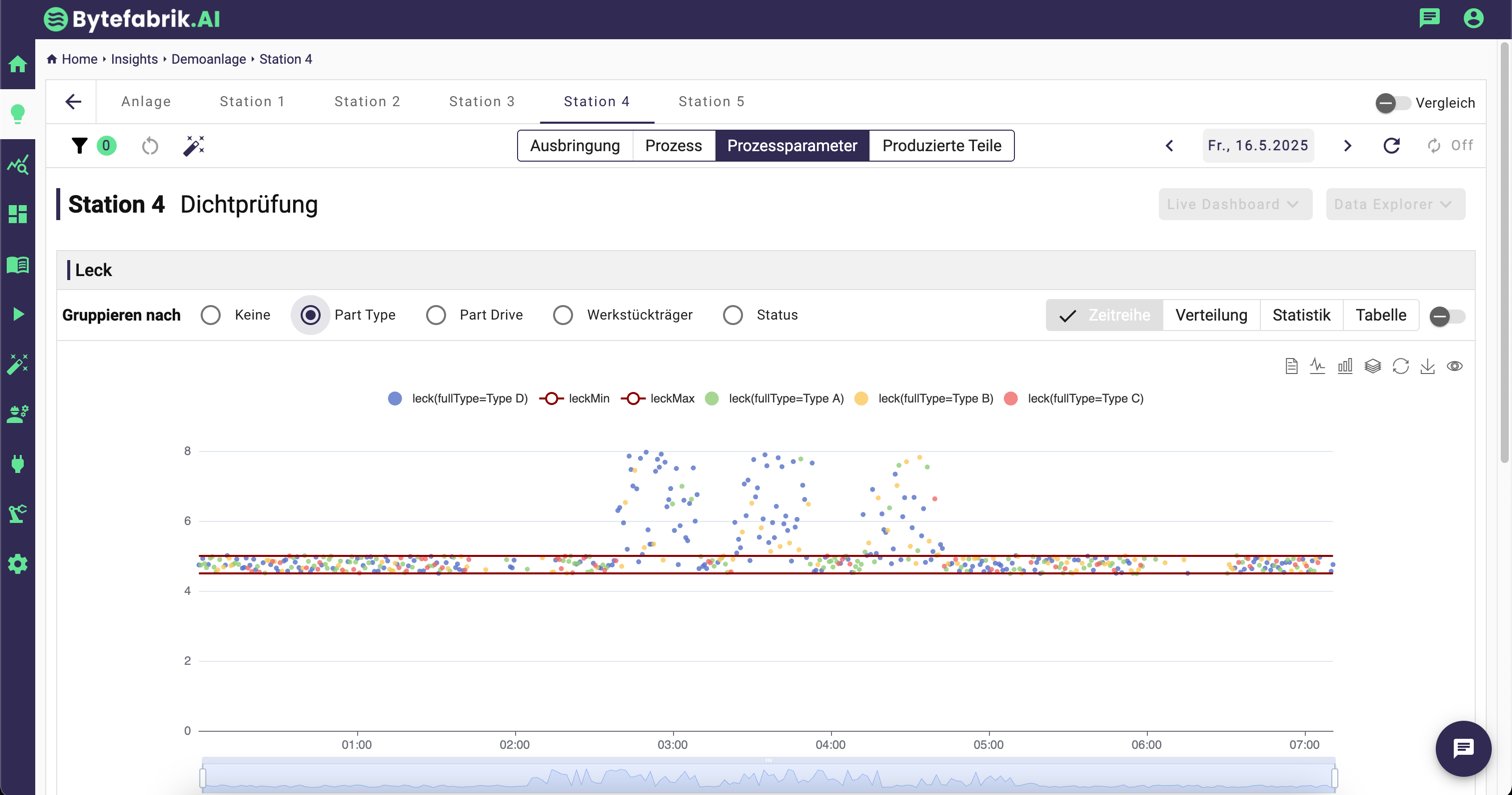
Once the problem has been narrowed down, the process parameters of the individual stations can be viewed. In this example, we see the process parameter view for the leak test process. All process parameters and their limit values can be displayed here and compared in different views. For example, specific coloring according to dimensions can be used to determine which assemblies are responsible for failed leak tests. Process stability can also be easily read off here, for example to identify trends that could lead to rejects in the future. With statistical evaluations, it is also possible, for example, to create box plots for all assemblies in order to identify whether certain assemblies lead to higher leakage values more frequently.
What it brings
Production analysis enables process engineers to get to the bottom of problems with a very high level of detailed data. This directly improves key performance indicators - our customers typically achieve improvements in scrap and rework rates of over 50%.
Plant analysis is a first, simple way to achieve real added value from existing data. No historical data is required and initial results are visible within days.
Production analysis is therefore also suitable for companies that have already made initial investments in data infrastructure but are now wondering what economic value they can derive from this data.
You don't want to analyze the data yourself, but just want to be informed about problems and anomalies? Then take a look at our AI-supported Manufacturing Analytics Copilot!