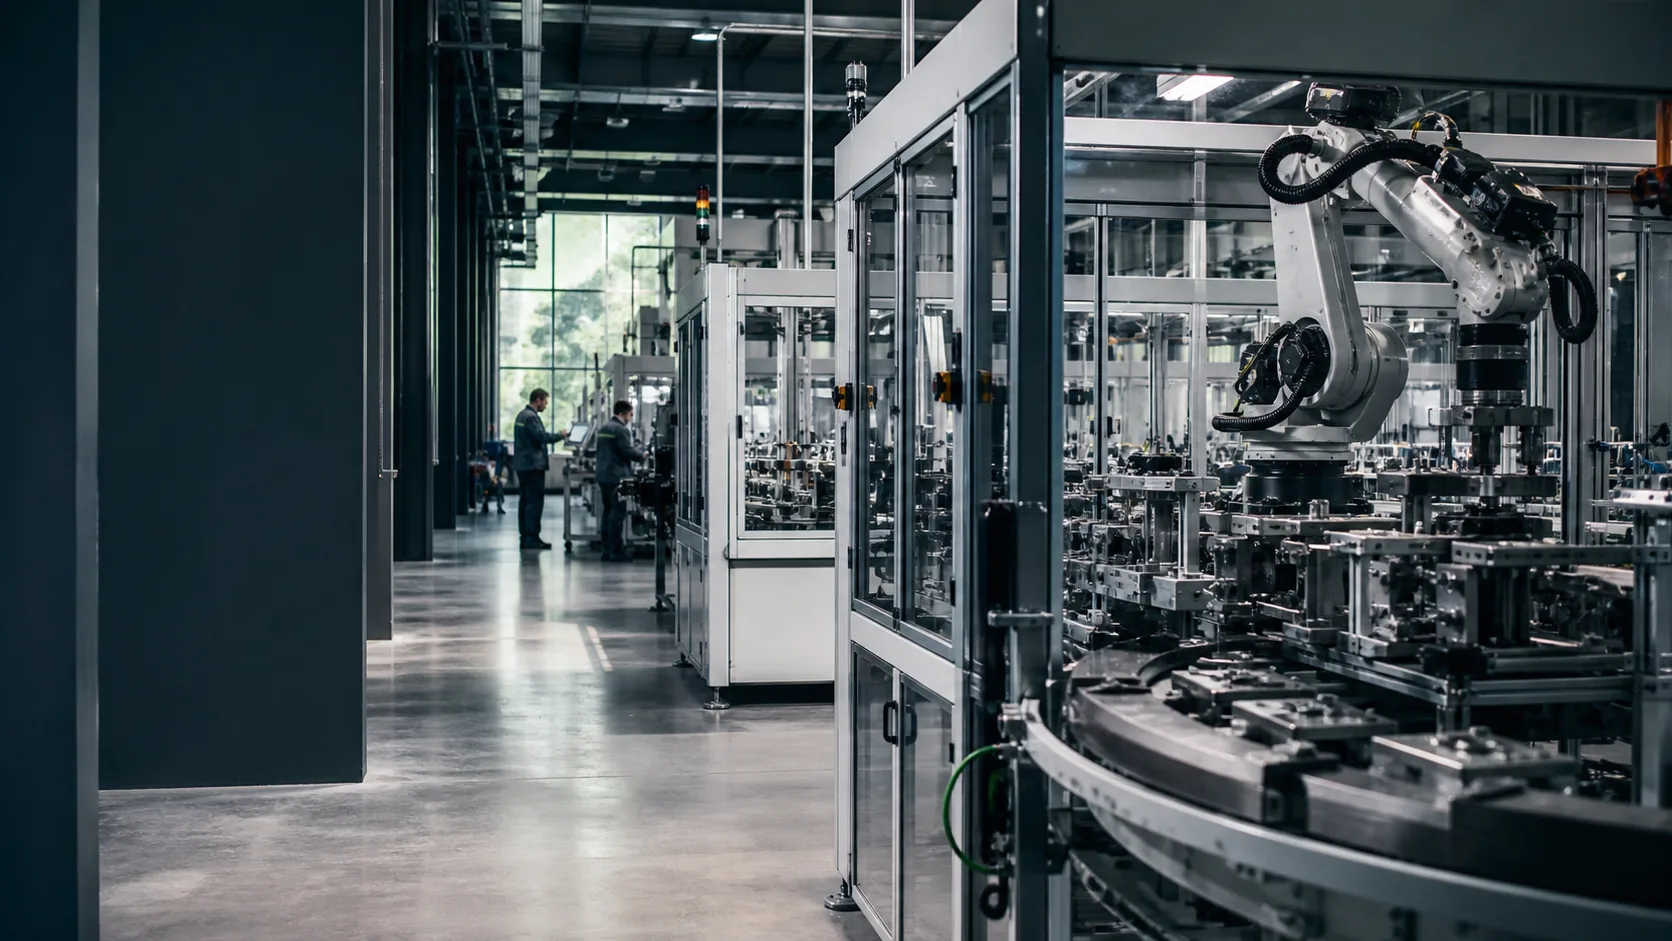
Proven in production.







Example Applications
What costs your team time or production performance today?
The use of machine data to improve production often fails due to the complexity of integration, siloed software solutions, and a disconnect between IT and production.
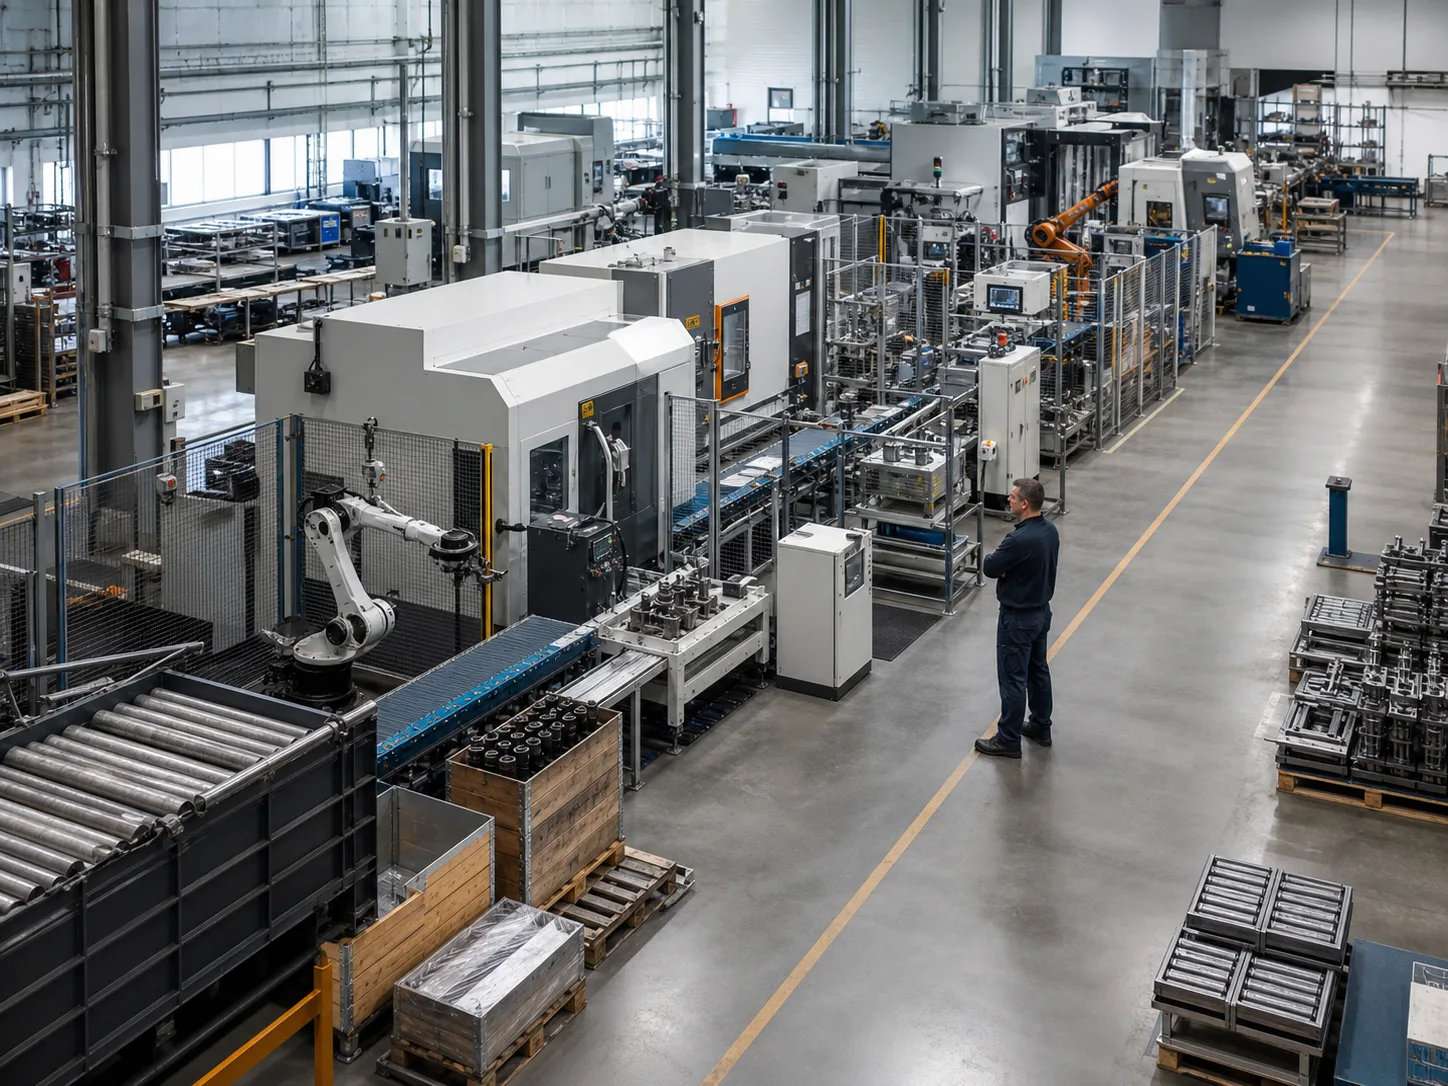
No more integration projects: Our platform enables data collection, processing, and implementation in no time.
View IoT Data Hub
Data flow
How machine data reaches your analyses
The IoT Data Hub connects controllers and systems via standard protocols, prepares the data and makes it available to dashboards, AI analyses and the Manufacturing Insights modules.
- OPC UAControllers and servers
- Siemens S7Read PLCs directly
- MQTTSensors and gateways
- ModbusLegacy equipment
- IO-LinkField devices
- RESTMES, ERP and other systems
Unlock the potential of machine data to make production more efficient.
We pick up where others leave off. In addition to a high-performance data platform, we provide all the modules needed to measurably improve your production output.
What does your team want to achieve first?
IoT Data Hub
Machine data collection in minutes instead of days. Data management for a clean data infrastructure, and incredibly simple data preparation with optional AI support.
Connectivity · Data Management · Visualization · AI Support
View IoT Data HubWhat working with it looks like
From the machine to the answer: In software that is easy to use.
Seven steps from everyday production: connect data, prepare it, gain transparency and find causes with the Copilot.
- Explore connectivity
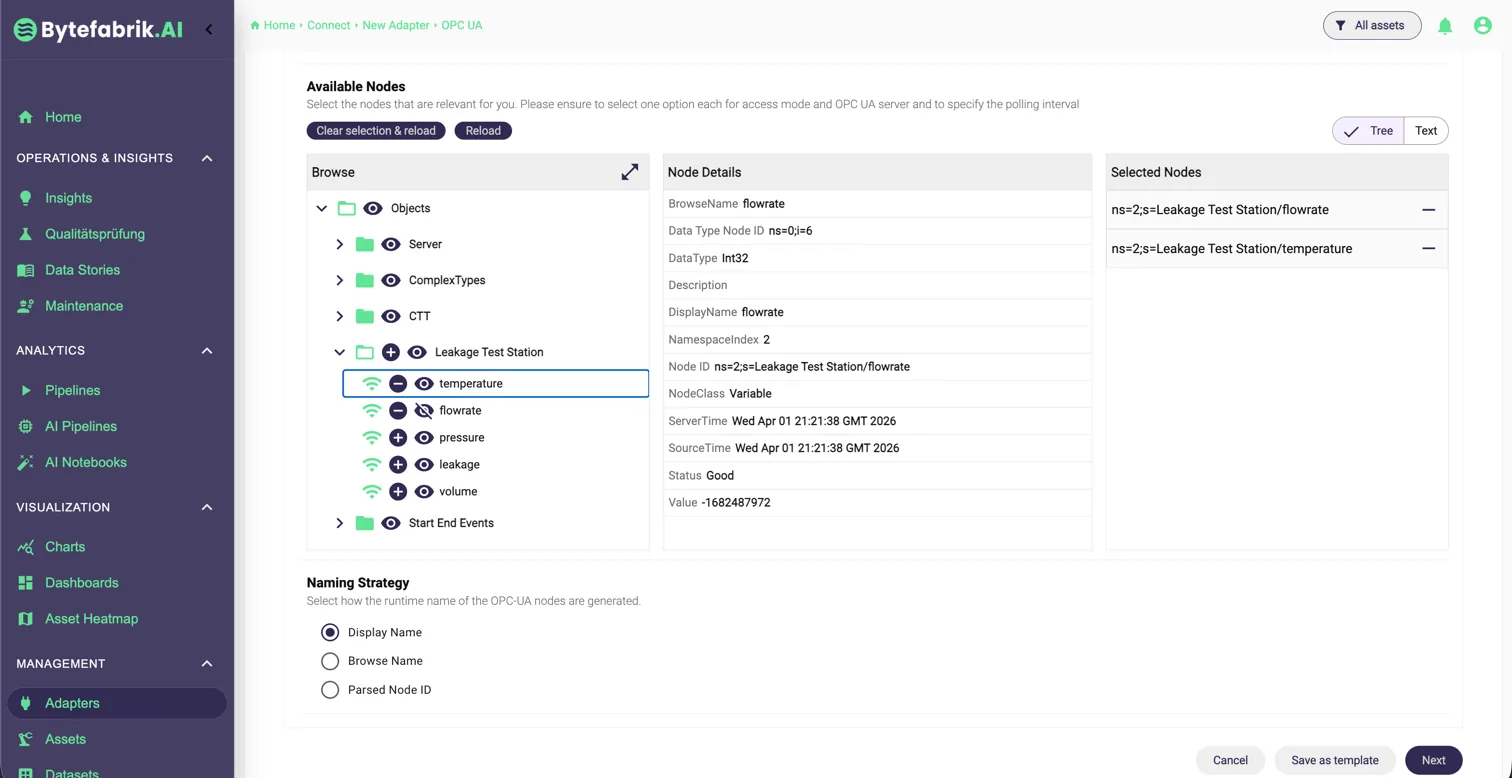
Select the test station signals - View AI Pipelines
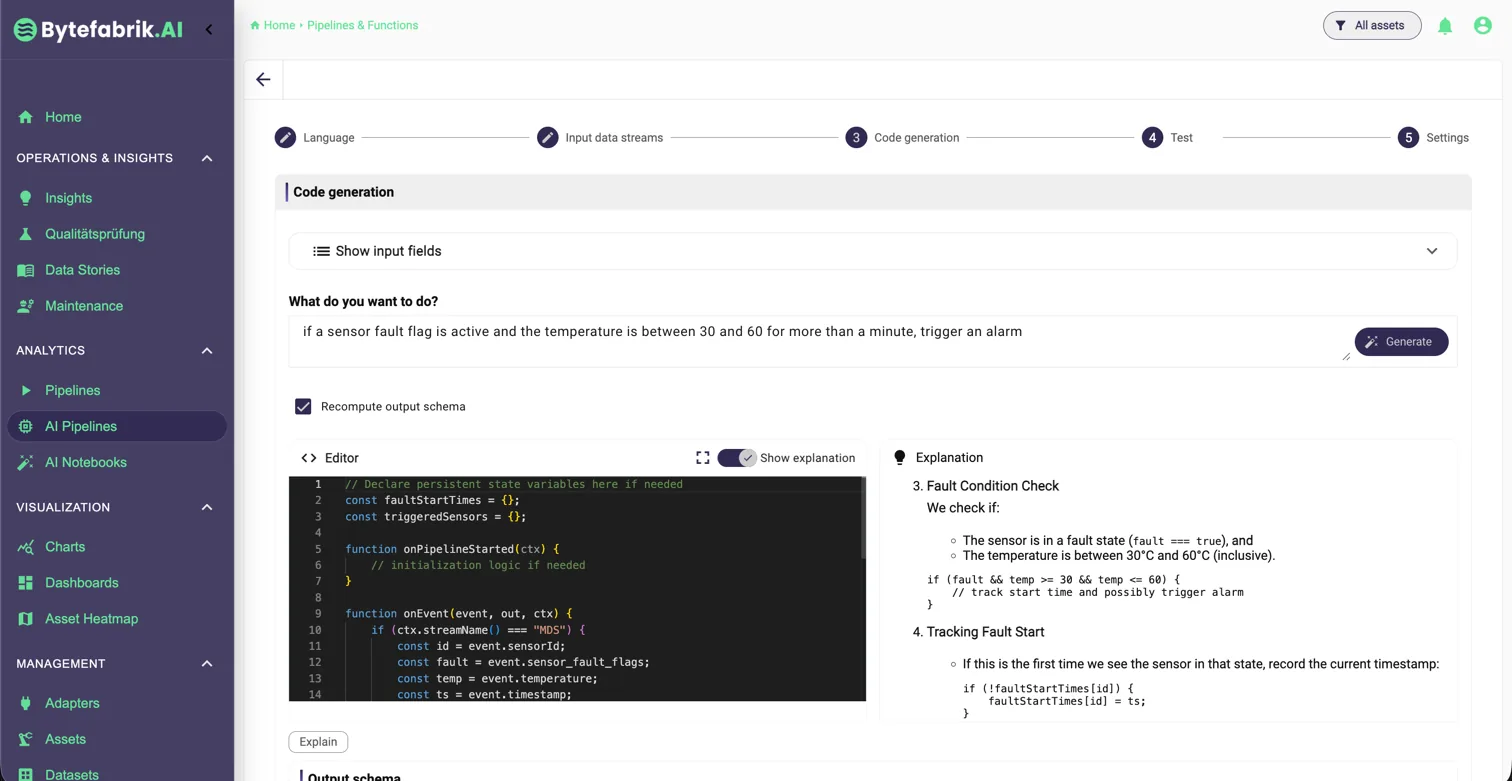
Task in one sentence - View Manufacturing Insights
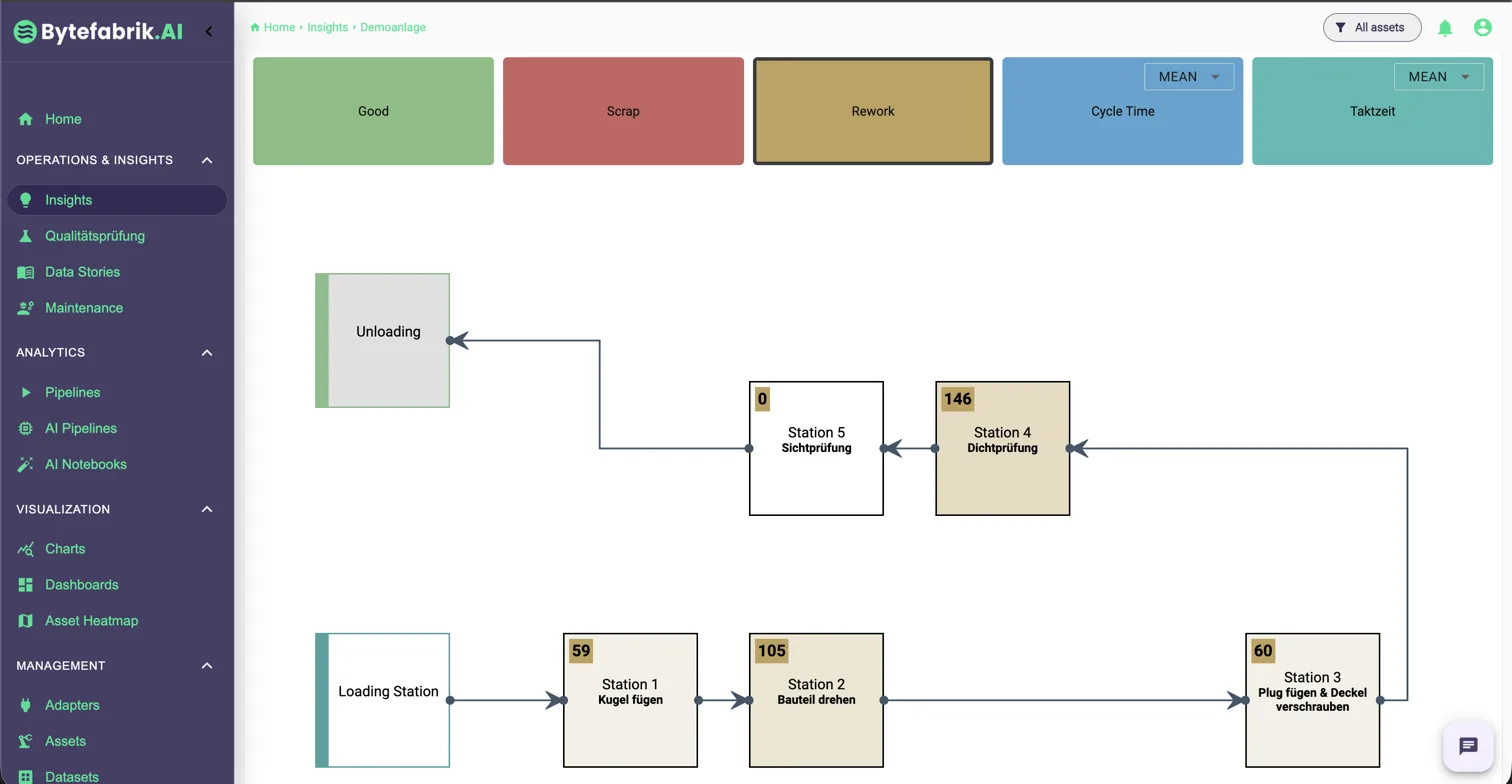
146 parts in rework at the leak test - View production analysis
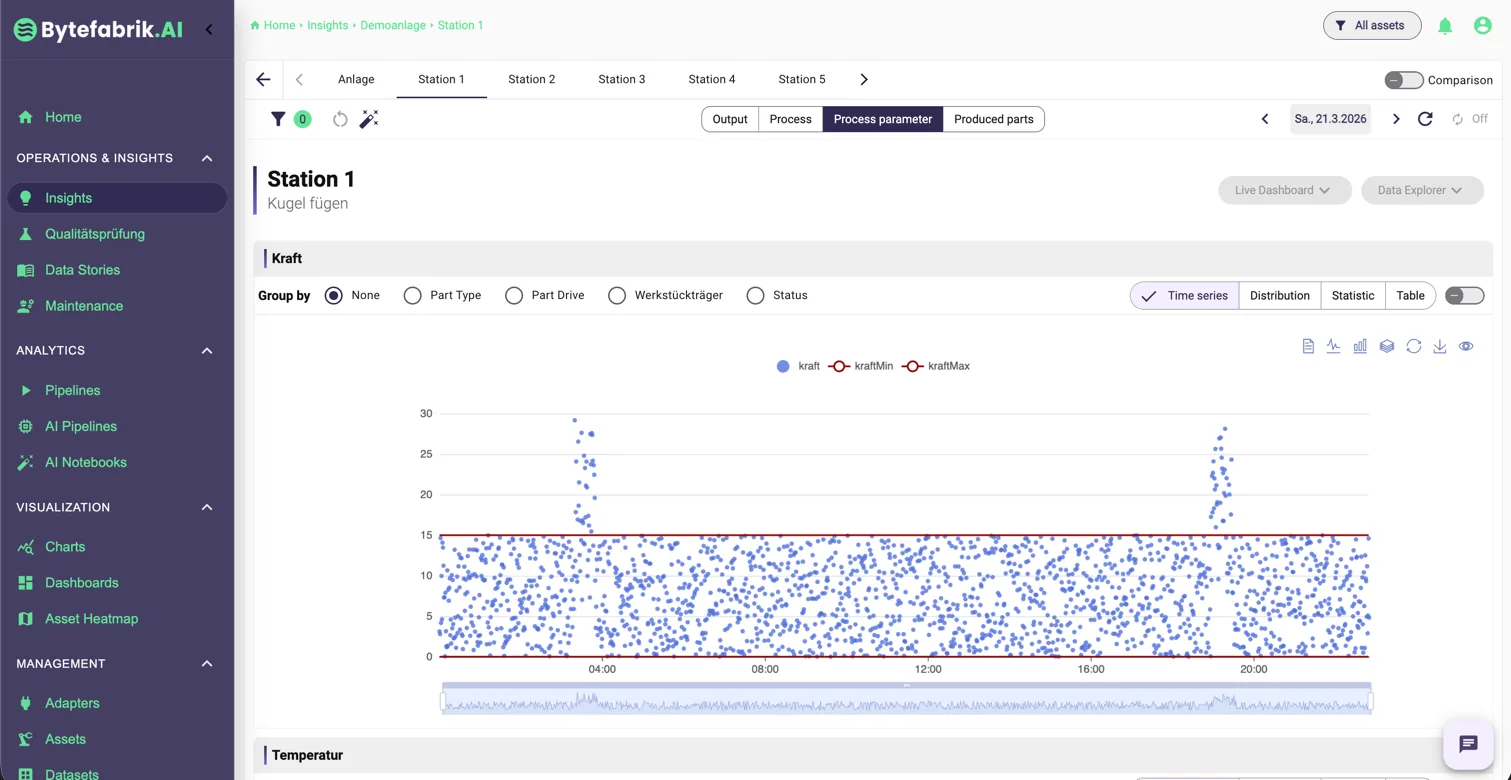
Force above limit - View product tracking
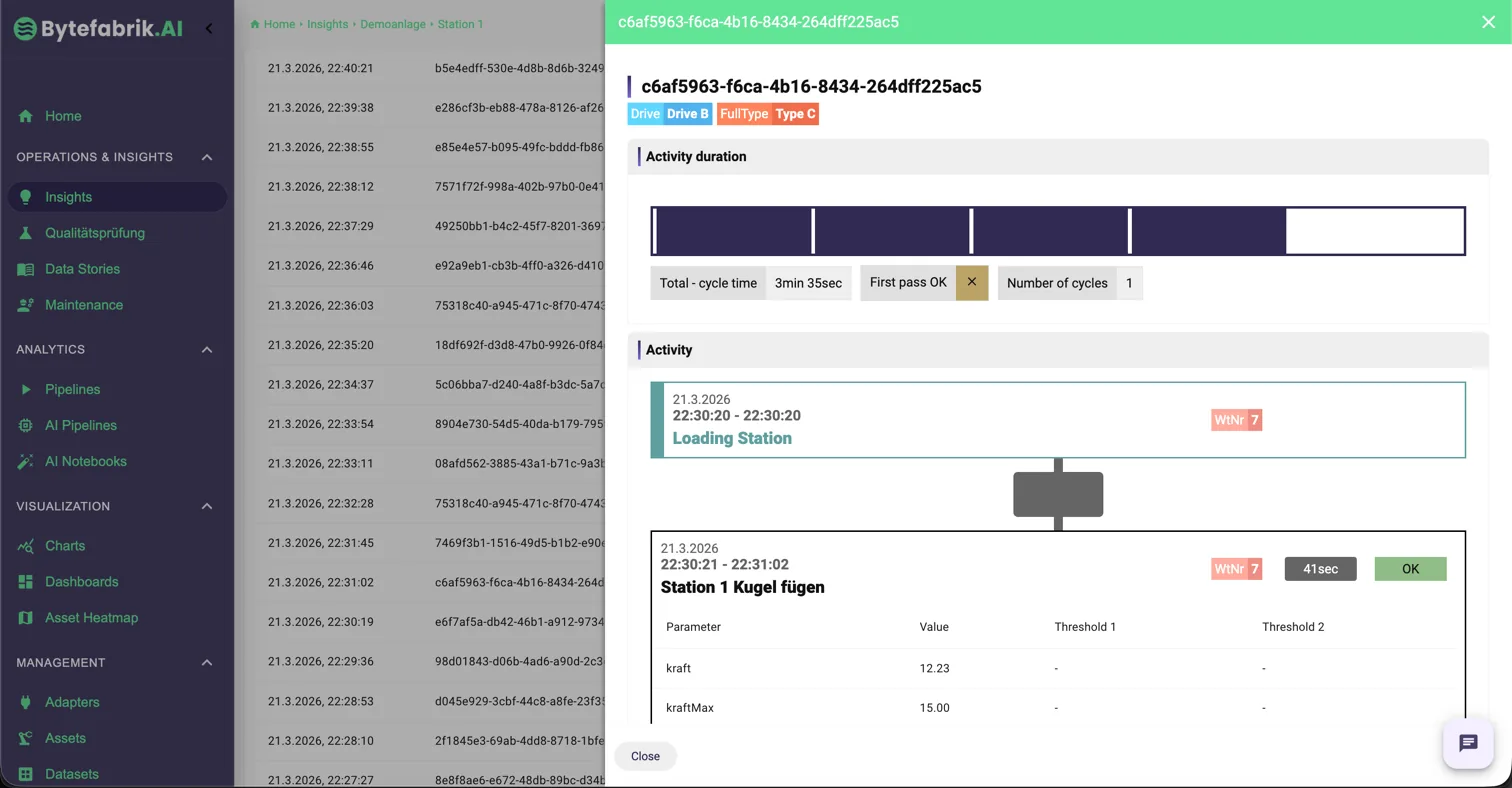
Test result and process values per station - View data stories
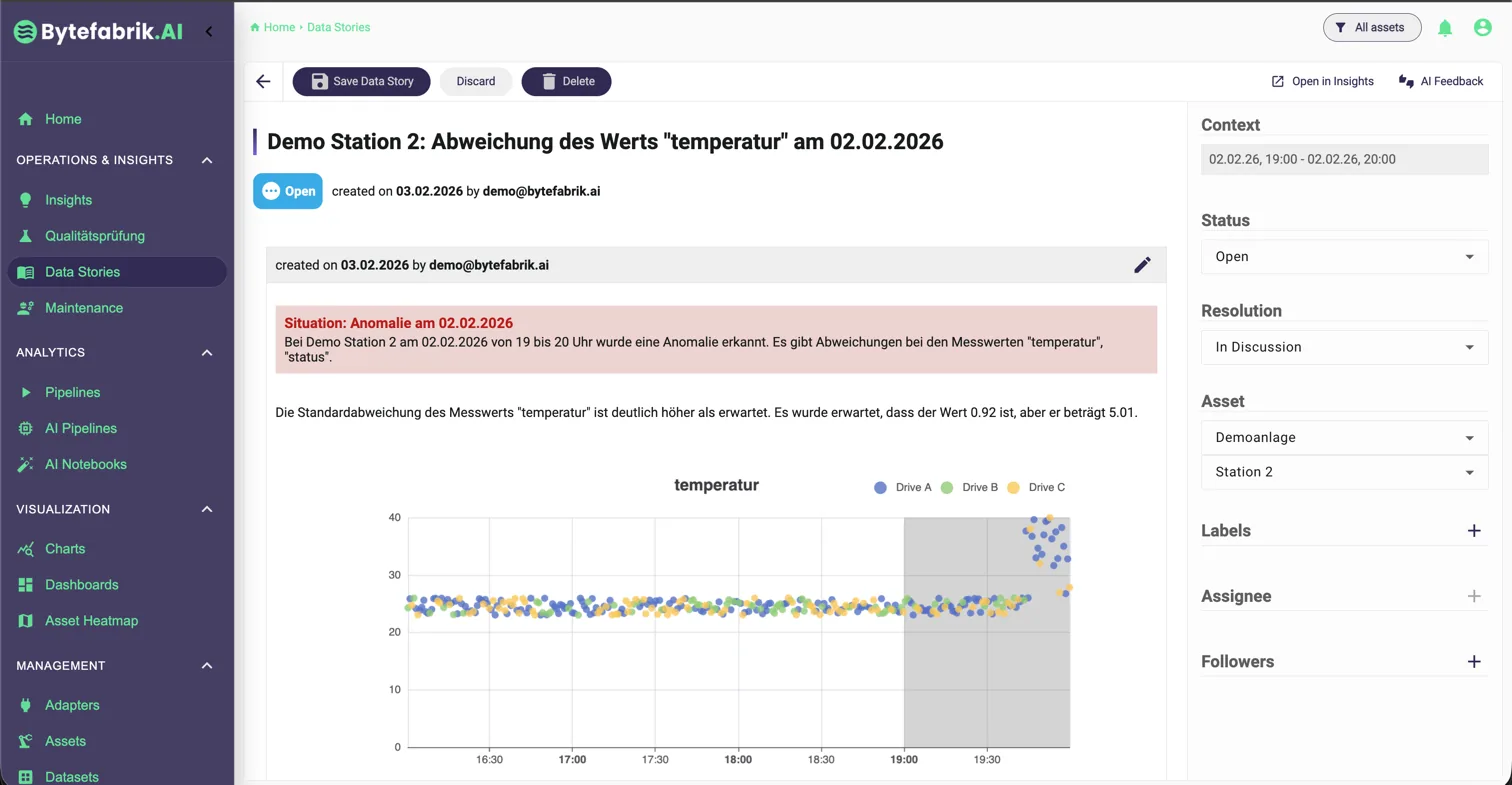
Detected period of the deviation - View Copilot
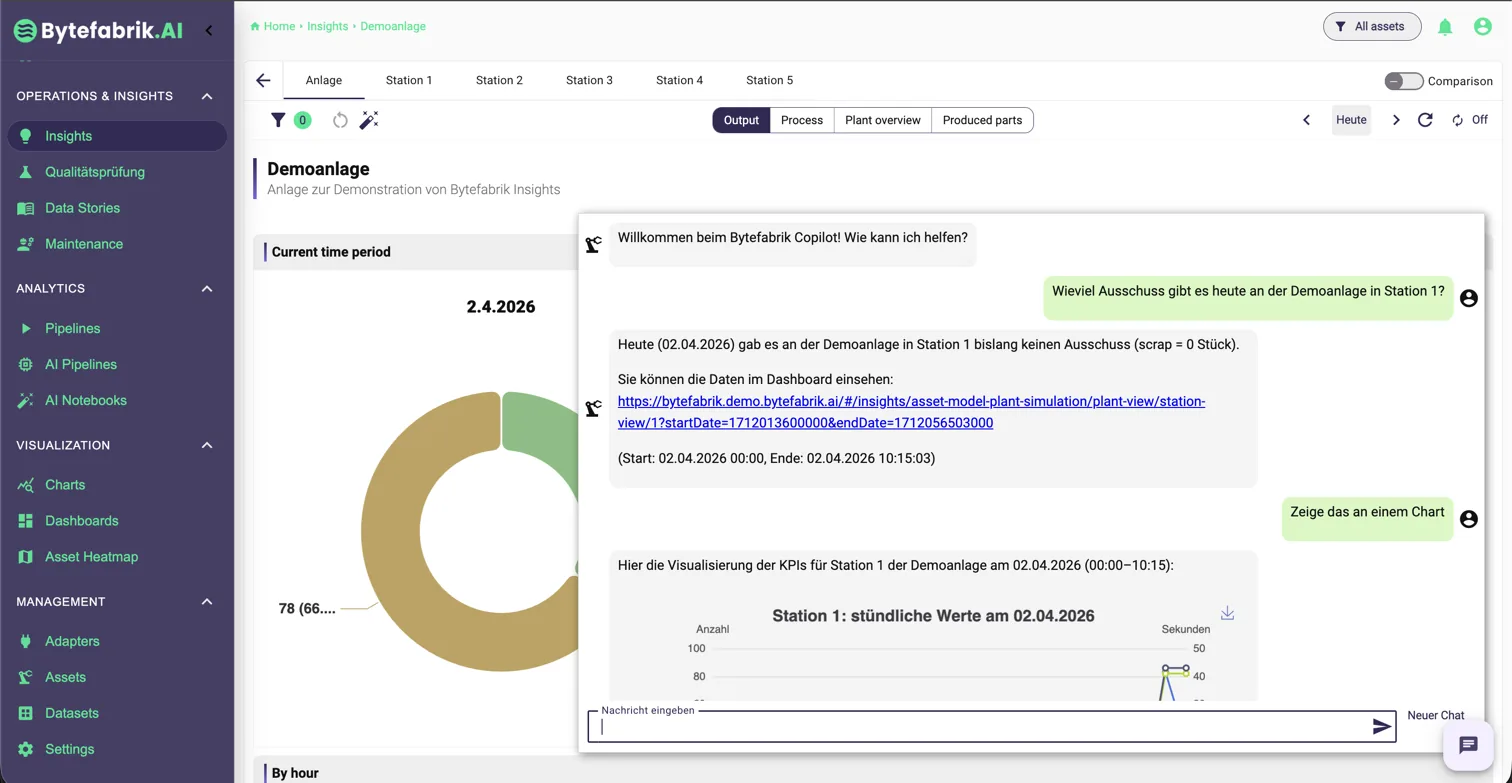
Answer with a link into the analysis
Built on open source. Made for your production.
> 800,000,000
data points processed daily
Open-source foundation
Built on Apache StreamPipes. Open, extensible and ready to integrate through open interfaces.
On-premise
Your data stays with you. Run the platform on your own infrastructure.
AI support throughout
From data preparation to analysis: AI supports your team in its daily work.
Safe Operation
SSO, rights management, audit logs, monitoring, and other features for professional operation.
Bring AI into production: securely and with minimal data usage.
AI pipelines
With AI pipelines, you can prepare data in the format required for analysis—without a time-consuming development project.
Explore AI PipelinesAI notebooks
Production is always unique. With AI notebooks, you can create reports that help the shop floor, rather than laboriously configured dashboards.
Explore AI NotebooksManufacturing Analytics Copilot
Do you have a large number of facilities? Our intelligent, locally running AI agent helps process engineers identify the most pressing issues and lighten their workload.
Explore the CopilotOur commitment to you
We support your business for the long term. With software that fits your production. With advice that gives you direction. And with a team that works alongside you to put it into practice.
Together, we find the right starting point, bring your application into operation and continue developing it with you. After launch, we remain your point of contact — for everyday questions and the next steps.
Over 80 percent fewer parts requiring rework
In an automotive gear drive assembly customer project, the number of parts requiring rework was reduced by more than 80 percent.
- Gearbox assembly
- Leak test per workpiece carrier
For two of eight workpiece carriers, the leak test failed far more often. The carriers did not seat exactly at the test station; the parts themselves were fine. The line KPIs did not show it.
Result: Fixtures of both carriers repaired.
Here's how we get started
From workshop to pilot in a few days to weeks.
A pilot project gives you a quick first impression: We connect the first machines, implement a suitable use case, and work with you to evaluate the benefits achieved.
Discuss a pilot- 01WorkshopFirst data sources
Start directly with your machine data
You'll see the first data right away during the on-site workshop. Together, we'll select a system and a suitable use case.
- 02SetupImplementation
Put a production line’s data to work
We work closely with you to configure the software to meet your needs, prepare the data, and implement an appropriate analysis. Depending on the task and scope, we use dashboards, AI analyses, or our Manufacturing Insights modules.
- 03Pilot operationAssess value
Experience and Evaluate Added Value
From now on, you’ll have a real-time view of production. After a training period and a few weeks of operation, we’ll review the agreed-upon goals and plan the next steps. After that, the rollout can proceed to additional machines, locations, or worldwide.
30-minute product demo
See what your data can do in 30 minutes
We show how machine data is connected and analyzed, from AI-assisted data preparation to investigating production losses. Get a concrete impression of the right starting point. No preparation needed.