Industry

Investigate rework in automotive assembly

When defects are first detected during final inspection, the search often begins several stations back. Manufacturing Insights links inspection results, process parameters, and product history so that production experts can narrow down deviations by product, station, and time period.

Typical symptoms in automotive lines

In automotive environments, individual process parameters are often critical. This makes it all the more important to have solutions that do more than simply visualize data; they must also enable the traceability of individual process steps all the way down to the process parameters.

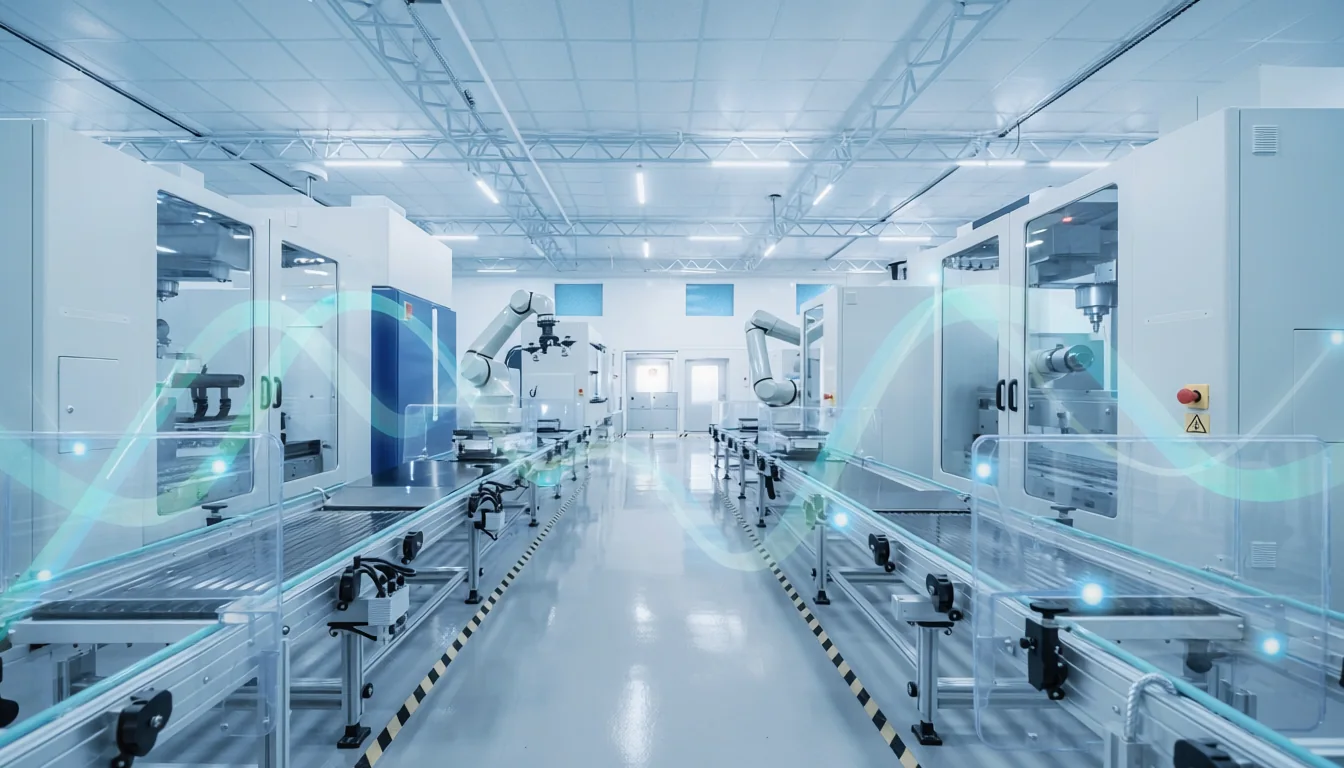
Automated production line with quality inspection
Where analysis begins
  1. 01

    Rejects and rework

    Quality deviations often only become apparent in downstream inspections or through increased reworking instead of directly at the process step that caused them.

  2. 02

    Hidden process deviations

    Tool conditions, workpiece carriers, screwdrivers, leak tests, and process parameters change gradually. Deviations are often not detected until it is too late.

  3. 03

    High traceability requirements

    Threshold values, test results, and real-time measurements must be available in a reproducible format for customers, audits, or complaints.

  4. 04

    Limited transparency

    In complex assembly and testing lines, it takes a lot of time to assign quality losses to the right station, the right carrier or a specific product variant.

Practical relevance

Example: Why does this product variant need rework more often?

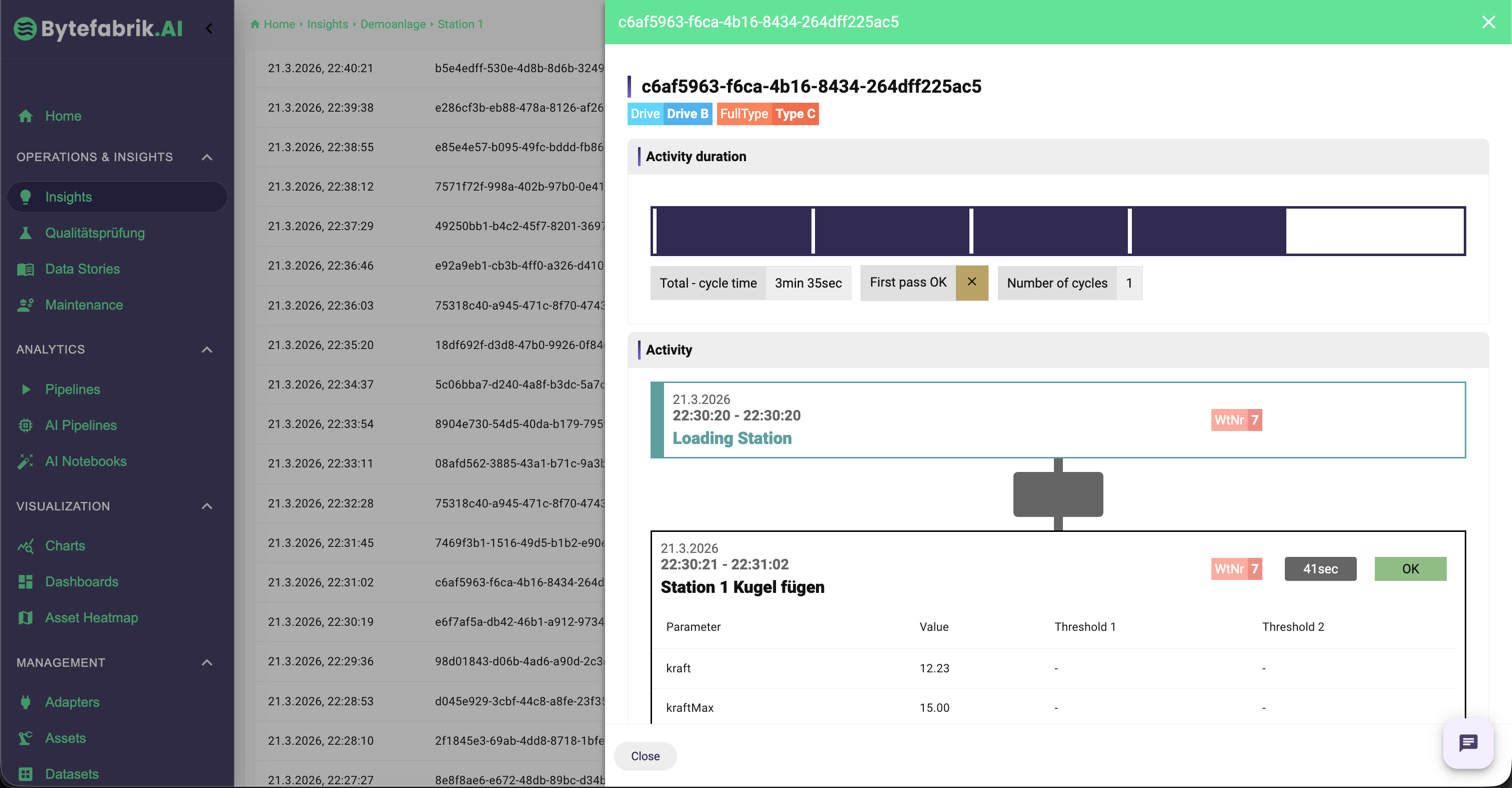
Narrow down the affected variant and time period. Compare the recorded process and inspection values, and track any parts that stand out throughout the assembly line. This allows you to immediately identify which stations or workpiece carriers are experiencing a high number of deviations.

  • Trace test values and process parameters per part
  • Recognize workpiece carrier or station reference recurring errors
  • Evaluate Measures Directly
View product tracking
Product and quality context in automotive lines
Result from a customer project

Over 80 percent fewer parts requiring rework

In an automotive gear drive assembly customer project, the number of parts requiring rework was reduced by more than 80 percent.

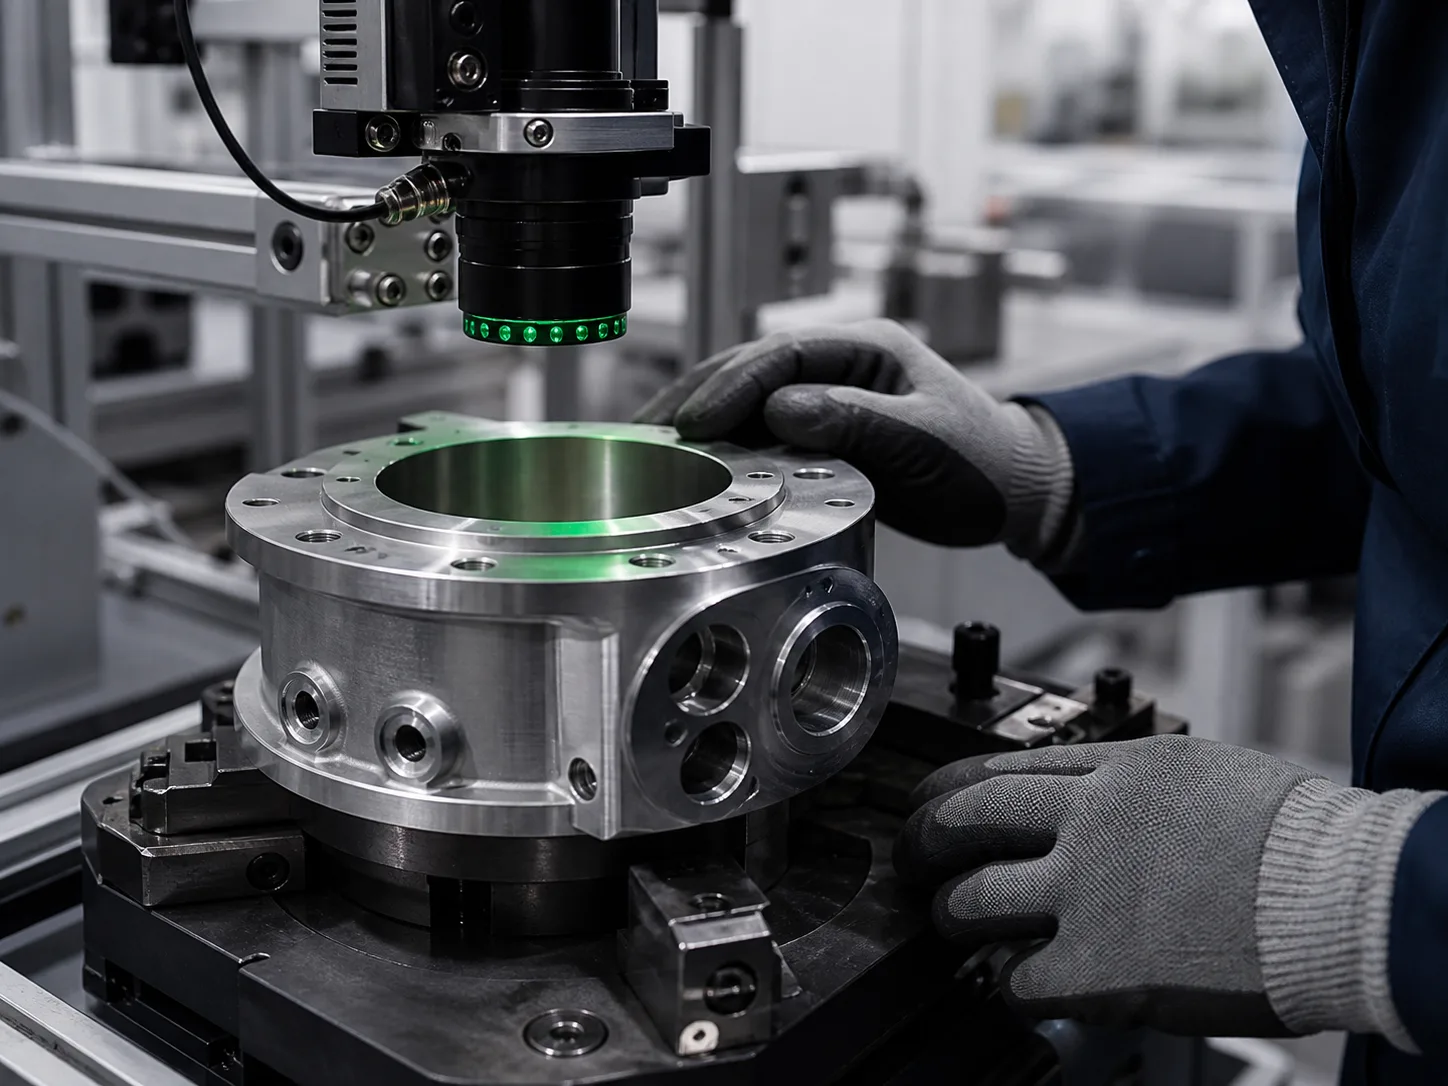
Quality inspection of a manufactured component

Analysis fields in automotive processes

These areas are particularly important in automated assembly and testing lines.

Quality and rework

  • IO / NIO / Rework processesEvaluate quality events by line, station, product family or shift.
  • End-of-line and testing processesAnalyze test results in connection with upstream process data.
  • Limit value and trend monitoringInvestigate trends and limit violations by product and period.

Process and station context

  • Screwing, joining and testing processesEvaluate force, torque, travel, tightness or other process parameters during the process.
  • Workpiece carriers and fixturesCheck whether problems cluster around specific carriers, fixtures, or machine components.
  • Product and variant referenceCompare deviations in connection with variants, assemblies or recipes.

Traceability and verification

  • Parts and batch historySearch process data, test values and context for each part produced.
  • Customer and audit certificatesProvide limit values, quality data and process histories in a traceable manner if required.
  • Error and alarm screensSystematically classify faults by station, assembly or time period.

Ready-made manufacturing analytics in the IoT Data Hub

Function blocks for automotive contexts

Manufacturing Insights extends the IoT Data Hub with ready-made production, process, and part analyses. We map your machine, product, and test data to the required views; existing systems can be connected.

Product tracking
02Automotive Module

Product tracking

For parts histories, traceability and access to product-related process and quality data.

View product tracking

Start a pilot with a specific production loss question

For example: Which variant or station shows recurring rework? Within a few days to weeks, we set up a line and implement the appropriate analysis use case. Scope and data availability determine the timeline.

  1. 01

    Connect the first data sources in a workshop

    We'll work with you to select a system and a specific loss scenario. We'll connect the initial data sources directly during the workshop.

  2. 02

    Configure equipment and analysis views

    We configure the IoT Data Hub and the relevant Manufacturing Insights modules. States, errors, and the required product or process data are mapped.

  3. 03

    Evaluate the use case with your team

    With customized views, you can identify production losses early on. We evaluate the benefits based on the agreed-upon goals.

30-minute product demo

See the path from test result to part history

In 30 minutes, we'll show you how to narrow down quality deviations by product and analyze them using process values and part histories. No preparation required.

Request a 30-minute demo