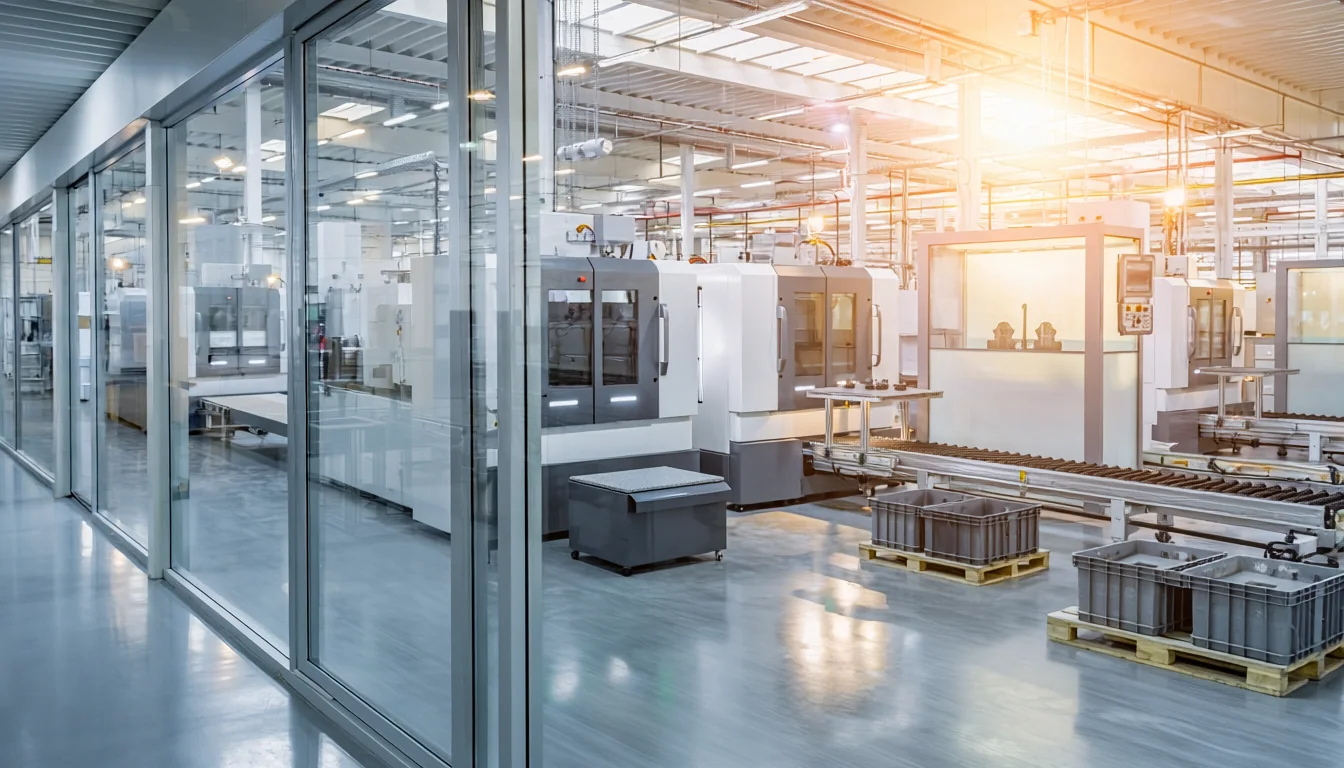
Three tasks from manufacturing: assign measurements to a shift, compare process curves and identify increasing rework. AI Pipelines and AI Notebooks are part of the IoT Data Hub. The Copilot extends the analyses in Manufacturing Insights.
AI Pipelines: prepare measurements for analysis.
Standardize timestamps, convert units and assign shifts: describe the processing you need. AI generates code that you can review and test with sample data.
After reviewing the pipeline, start it to apply the generated logic to the live data stream. AI supports development; the rules and results remain available for inspection.
Explore AI PipelinesAI Pipelines and AI Notebooks are tools within the IoT Data Hub.“Standardize timestamps and assign measurements to shifts.”
Shift assignment requires timestamps, the plant time zone and a shift schedule. Also check shifts spanning midnight and missing values.
AI Notebooks: why do shifts differ?
Ask a question about stored production data. The AI Notebook generates Python code for the analysis and displays results as tables or charts. Follow-up questions let you change the comparison or narrow it down to the affected products.
Explore AI Notebooks“Compare the process curves for product A in the early and late shifts. Where do they differ?”
Compare the same product variant under comparable conditions. Check sample counts, missing values and the calculation before interpreting the difference.
Copilot: which machine needs your attention?
The Manufacturing Analytics Copilot examines available data from the Insights modules in the background. If rework increases on a line, for example, it can prepare a Data Story showing the period, comparison and supporting data.
Your team reviews the finding and asks follow-up questions in the chat: does the change affect all products or a particular variant? Linked analyses support further investigation. You work with the process owners to establish the cause and decide on an action.
Explore the Manufacturing Analytics CopilotQuality data shows that rework has changed. Investigating possible causes requires additional information, such as process parameters or part histories.
30-minute product demo
Which production question would you like to investigate with AI?
In 30 minutes, we use sample data to show how to prepare data, build a shift comparison or investigate an unusual development on a machine. Together, we identify the data needed for your question. You do not need to prepare data for the demo.