Manufacturing Insights · Production Analysis and OEE

Identify losses. Narrow down the causes to the specific station.

Production analysis combines OEE, output, cycle times, quality metrics, and process parameters. This transforms a notable metric into a verifiable loss within the production context.

Manufacturing Insights Add-on

Dieses Modul beantwortet eine konkrete Produktionsfrage auf der gemeinsamen industriellen Datenbasis.

Product Overview →

When the metric shows the loss but not its cause

Production analysis combines output, location, and process conditions to provide a comprehensive picture of areas for improvement.

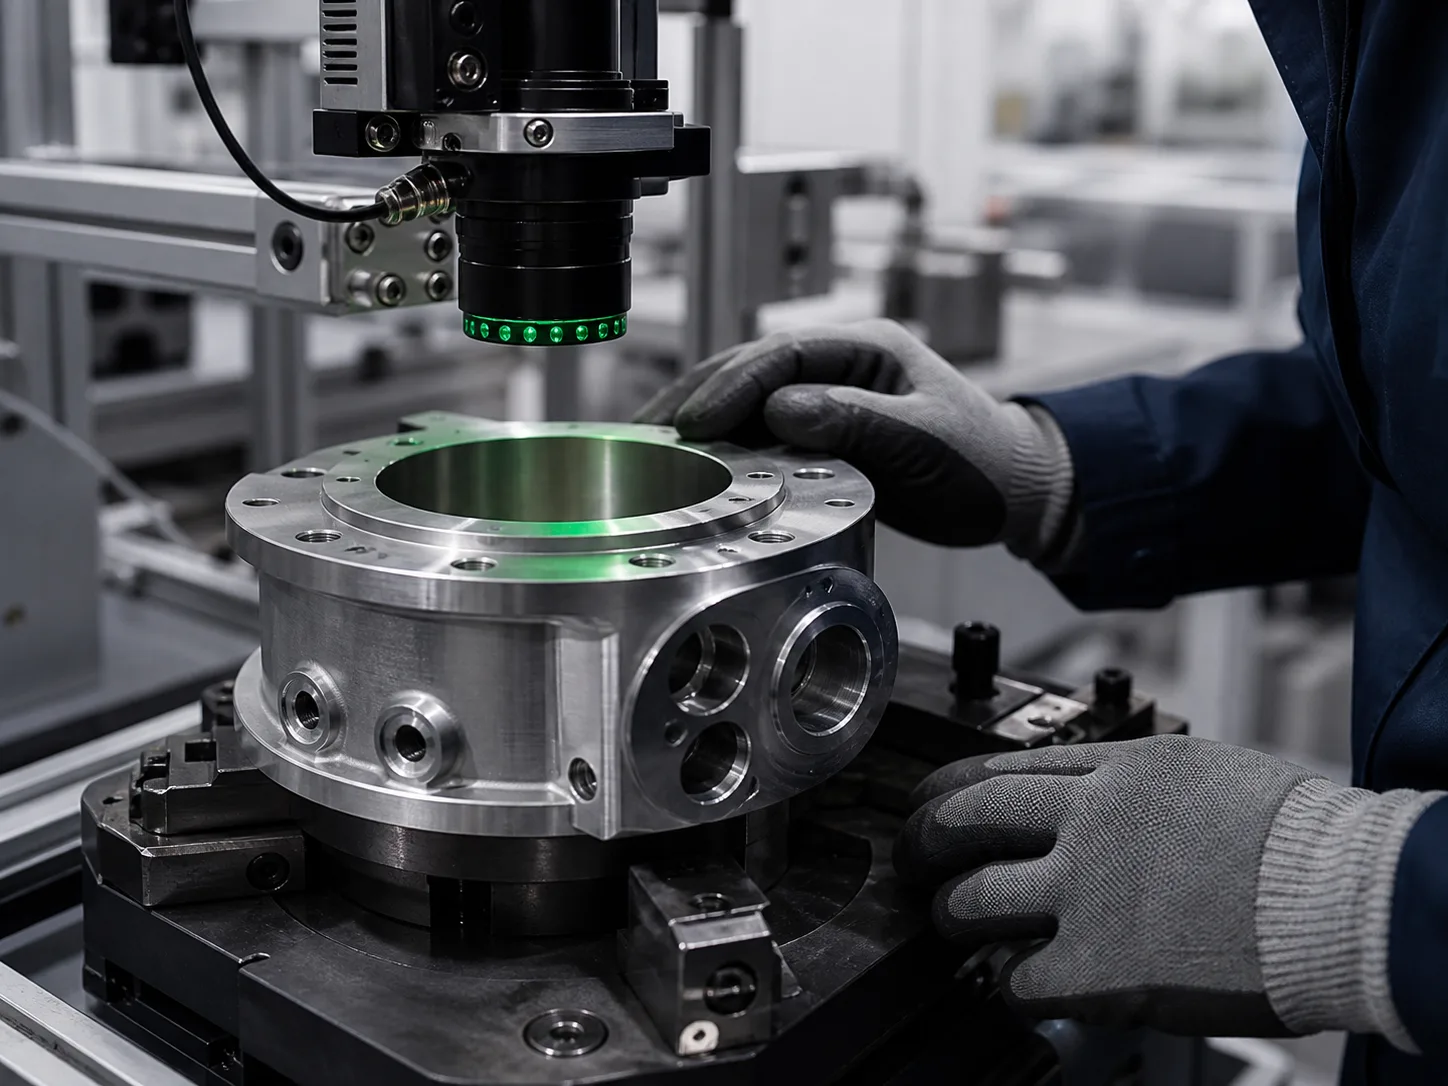
Quality inspection at an automated production line
Key metric. Context. Cause.
  1. 01

    OEE shows the loss, but not where it occurred

    An aggregated metric is not sufficient to identify the specific ward, shift, or product variant.

  2. 02

    Cycle time and output are considered separately

    Performance drops remain unexplained if cycle time, wait times, and actual output are not analyzed together.

  3. 03

    Quality deviations lack process context

    It is difficult to explain scrap and rework without considering the associated parameters, tools, and production conditions.

  4. 04

    Measures are not reviewed against the same basis

    Without a consistent before-and-after view, it remains unclear whether a change actually reduces the relevant loss.

Three levels of analysis for a robust drill-down

From the loss profile to the ward context to comparable process stability.

Loss ChartOEE · A/P/Q

Taking a Differentiated View of Availability, Performance, and Quality

The OEE scorecard breaks down the overall metric into clear components related to time, quantity, and quality. This makes it clear which factor is limiting the line.

  • Switch from the total value to the relevant loss component
  • Compare time periods, lines, and layers within the same definition
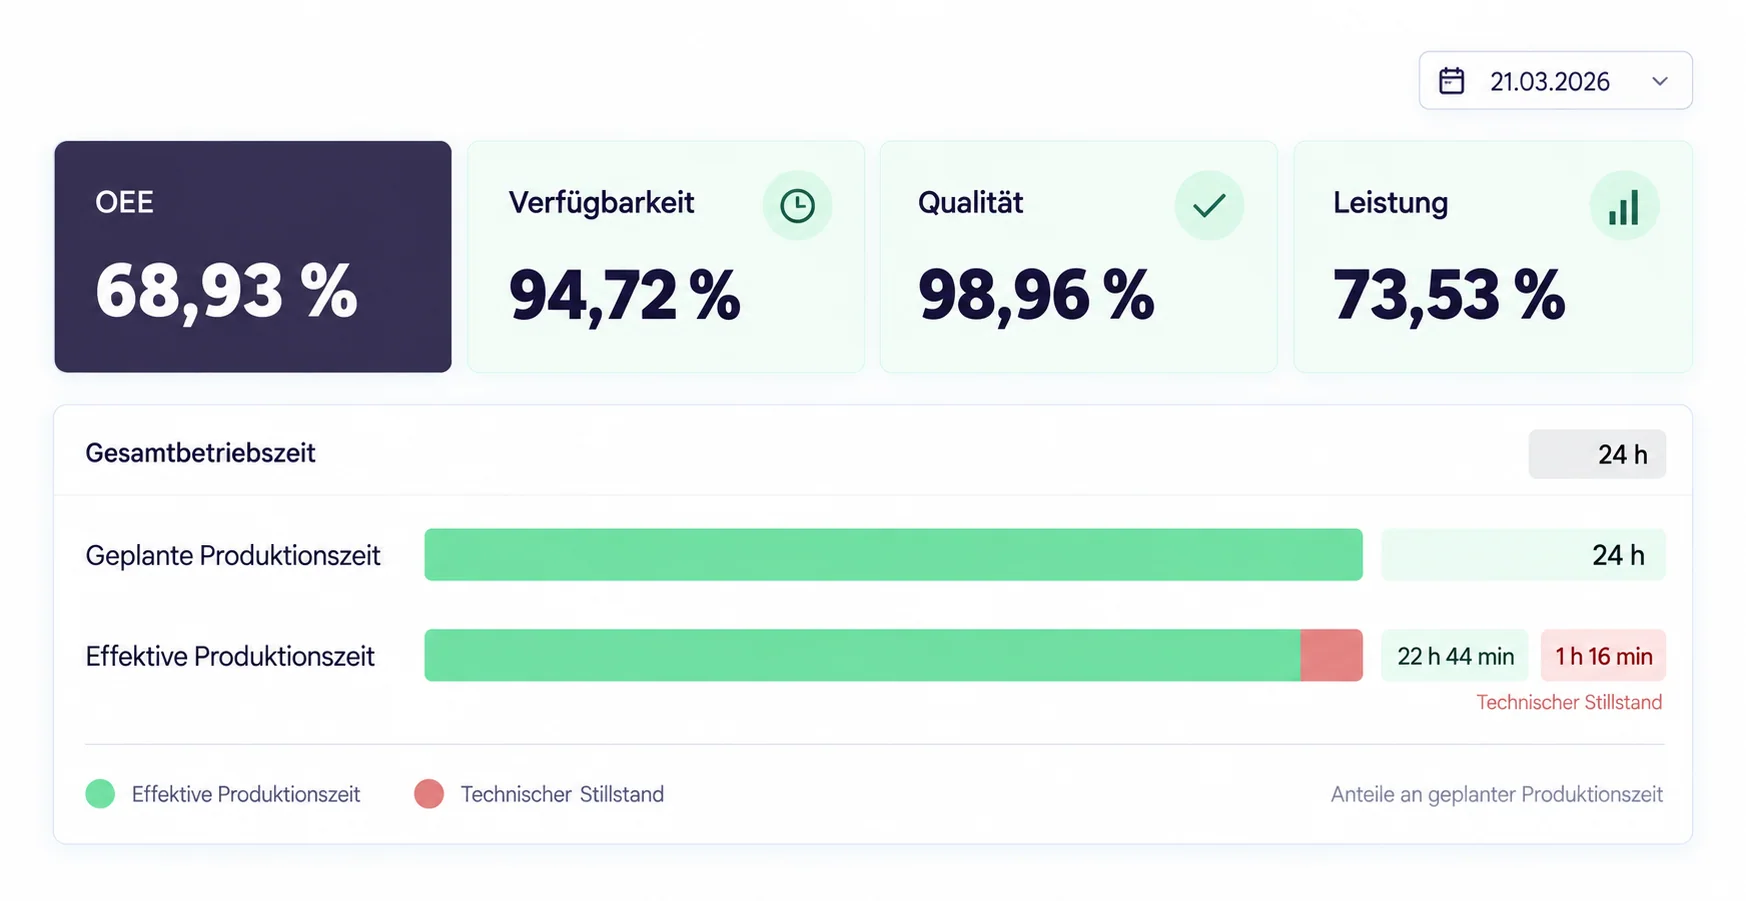
OEE Scorecard with Availability, Performance, and Quality
Context of CausesStation · Parameter

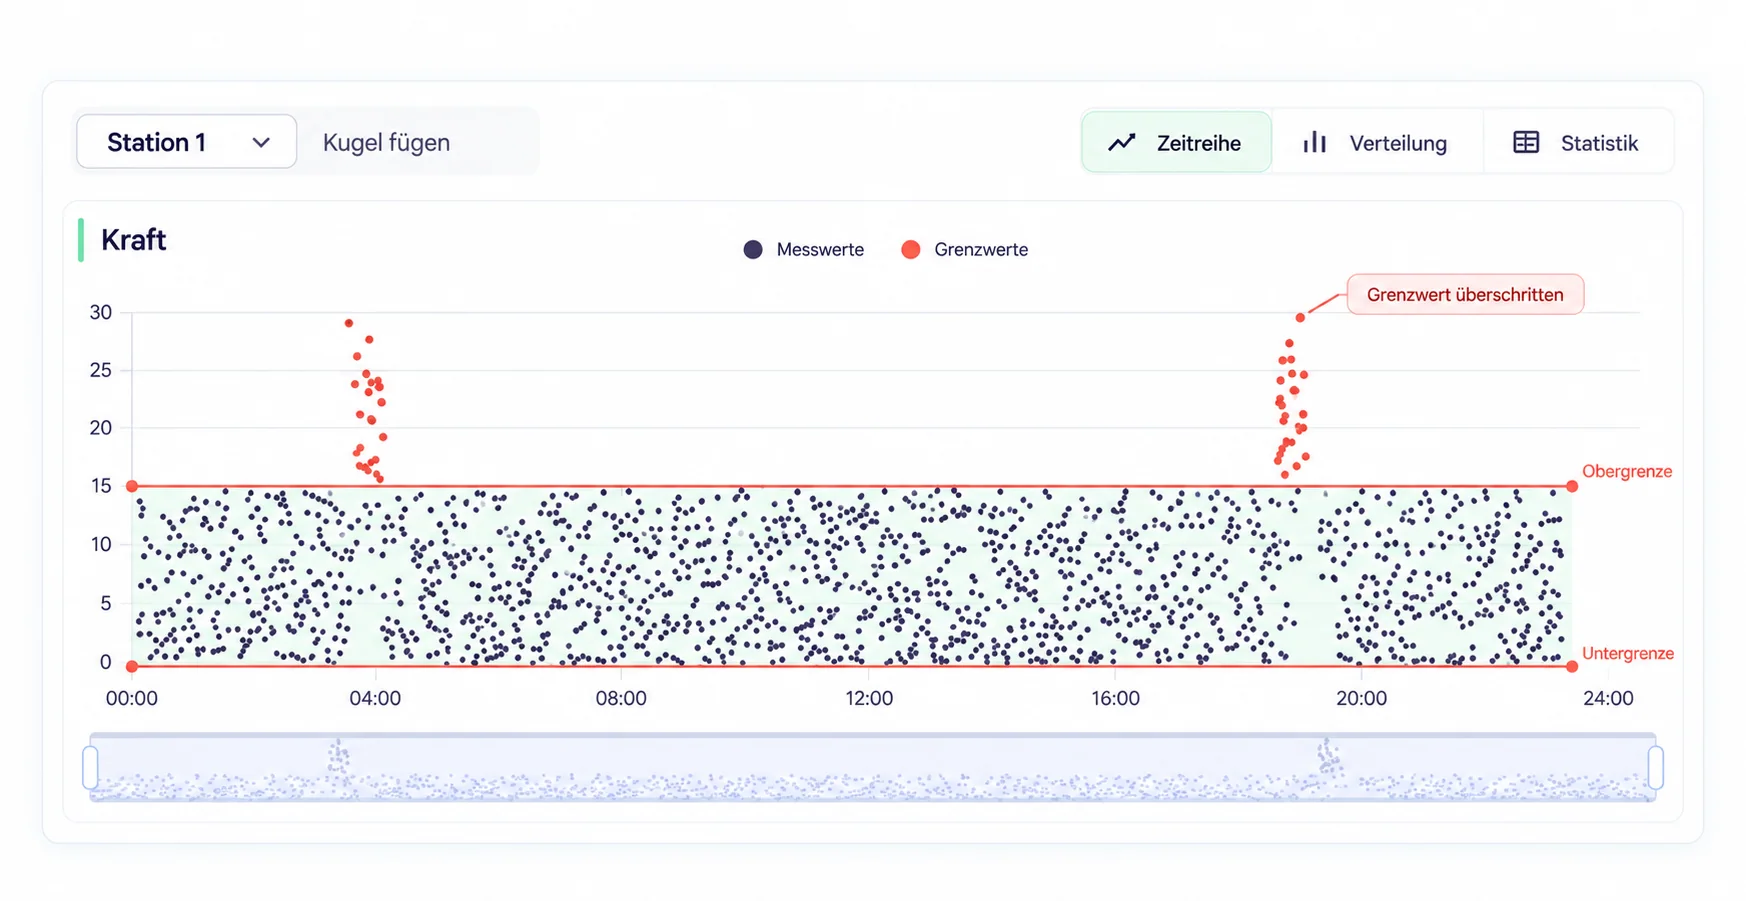
Investigate any unusual process parameters all the way to the station

Time series, distributions, and thresholds link a notable metric to the production conditions under which it was generated.

  • Group parameters by product, tool, or other characteristics
  • Identifying outliers and recurring patterns over time
Analysis of Process Parameters at a Production Station
StabilityDistribution · Comparison

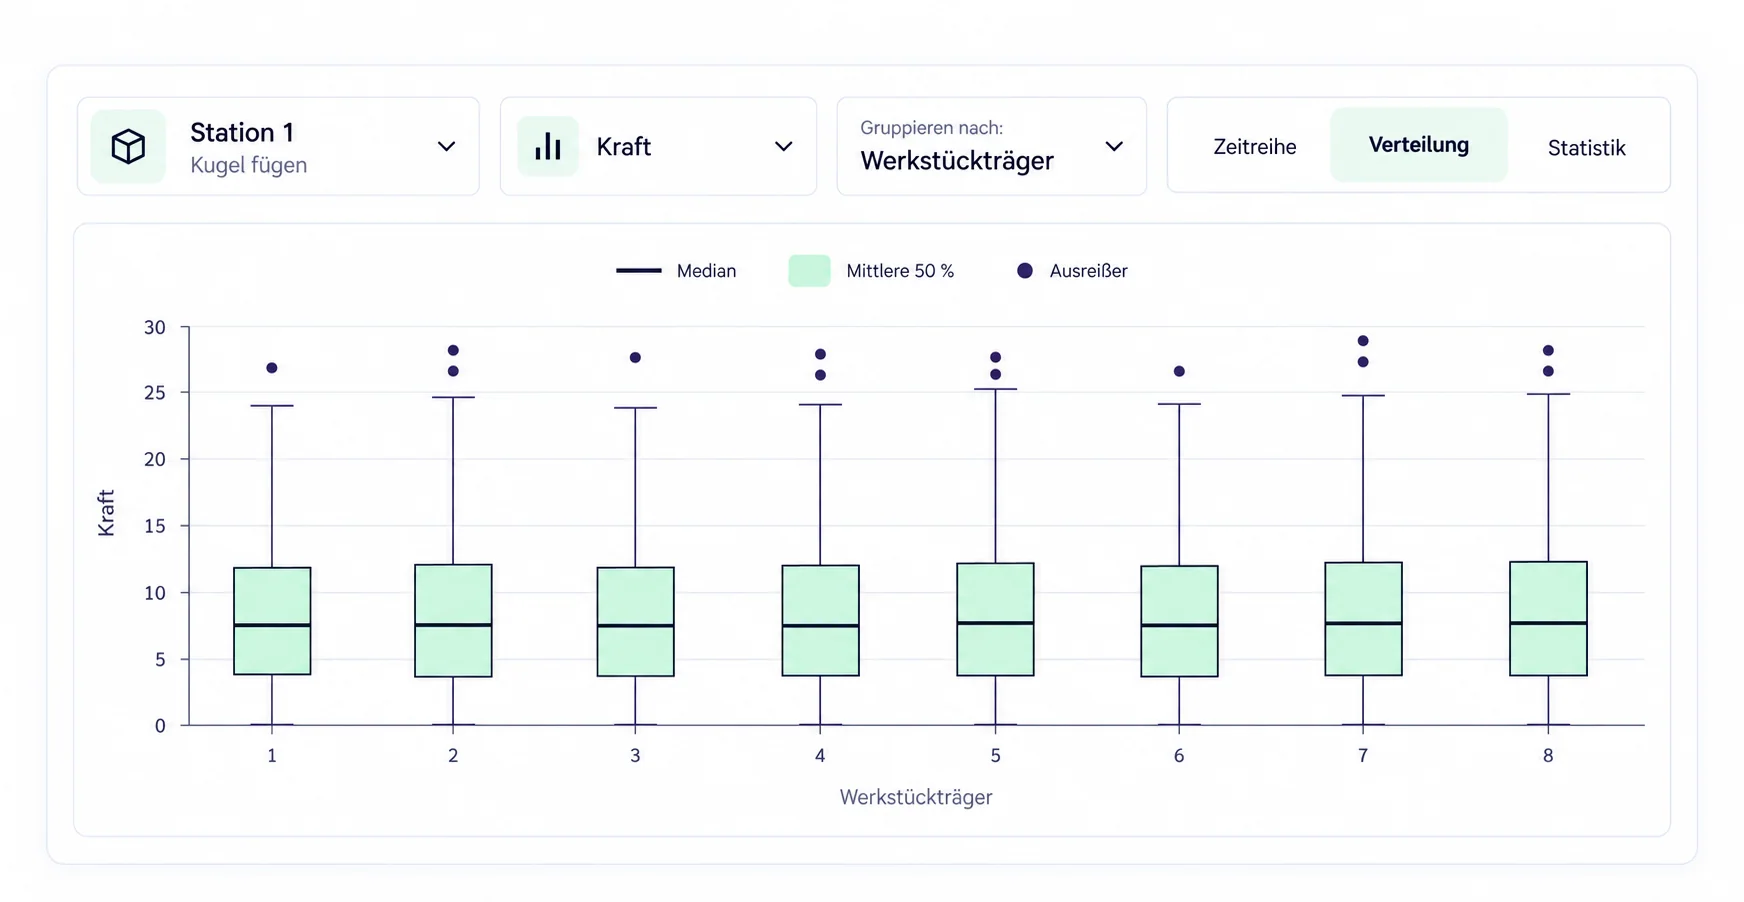
Making Variance and Process Shifts Comparable

Distribution views show whether a process changes systematically across product variants, tools, or time periods.

  • Visually separate stable and conspicuous groups
  • Re-evaluate the impact of a measure using the same analysis
Comparative Distribution Analysis of a Process Parameter

A Common Framework for Production Losses

The analysis distinguishes between different types of loss and reconnects them to their specific context of origin.

Availability
Time Losses

Clearly distinguish between planned and unplanned downtime.

Performance
Clock Speed and Output

Identify cycle time variances and performance shortfalls at each station.

Quality
Committee

Examine quality losses in the context of products and processes.

Improvement
Before/After

Evaluate measures using the same data and key performance indicators.

Data Base and Improvement

How Production Analysis Goes Beyond an OEE Dashboard

What data is included in the production analysis?

Depending on the situation, status signals, production quantities, quality metrics, cycle times, process parameters, and product, station, and tool context are linked.

Is OEE the only analytical model?

No. OEE establishes a common framework for analyzing losses. In addition, output, cycle times, process parameters, distributions, and product-specific quality relationships can be examined.

How far does the drill-down go?

Depending on the available data, the analysis can extend from the production line and time period down to the station, product variant, tool, shift, or individual process parameter.

How is the effectiveness of a measure evaluated?

The relevant time period and context are compared before and after implementation using the same metric definition. This makes it clear what loss the measure has affected.

30-minute product demo

Which production loss would you like to understand in more detail?

We'll walk you through the process—from the key metric to the station, product, and process parameters—using a specific loss case as an example.

Product demo featuring a specific loss scenario
Request a 30-minute demo
Quality Analysis at an Automated Production Facility