Procedure
Actual Path
Reconstructed from actual ward events that were recorded.
Manufacturing Insights · Process Analysis
Process analysis reconstructs the actual path taken by parts and batches. This reveals detours, backtracking, rework, and wait times that remain hidden in target processes.
Dieses Modul beantwortet eine konkrete Produktionsfrage auf der gemeinsamen industriellen Datenbasis.
Event-based process analysis shows the actual paths products take and where time or capacity is lost.
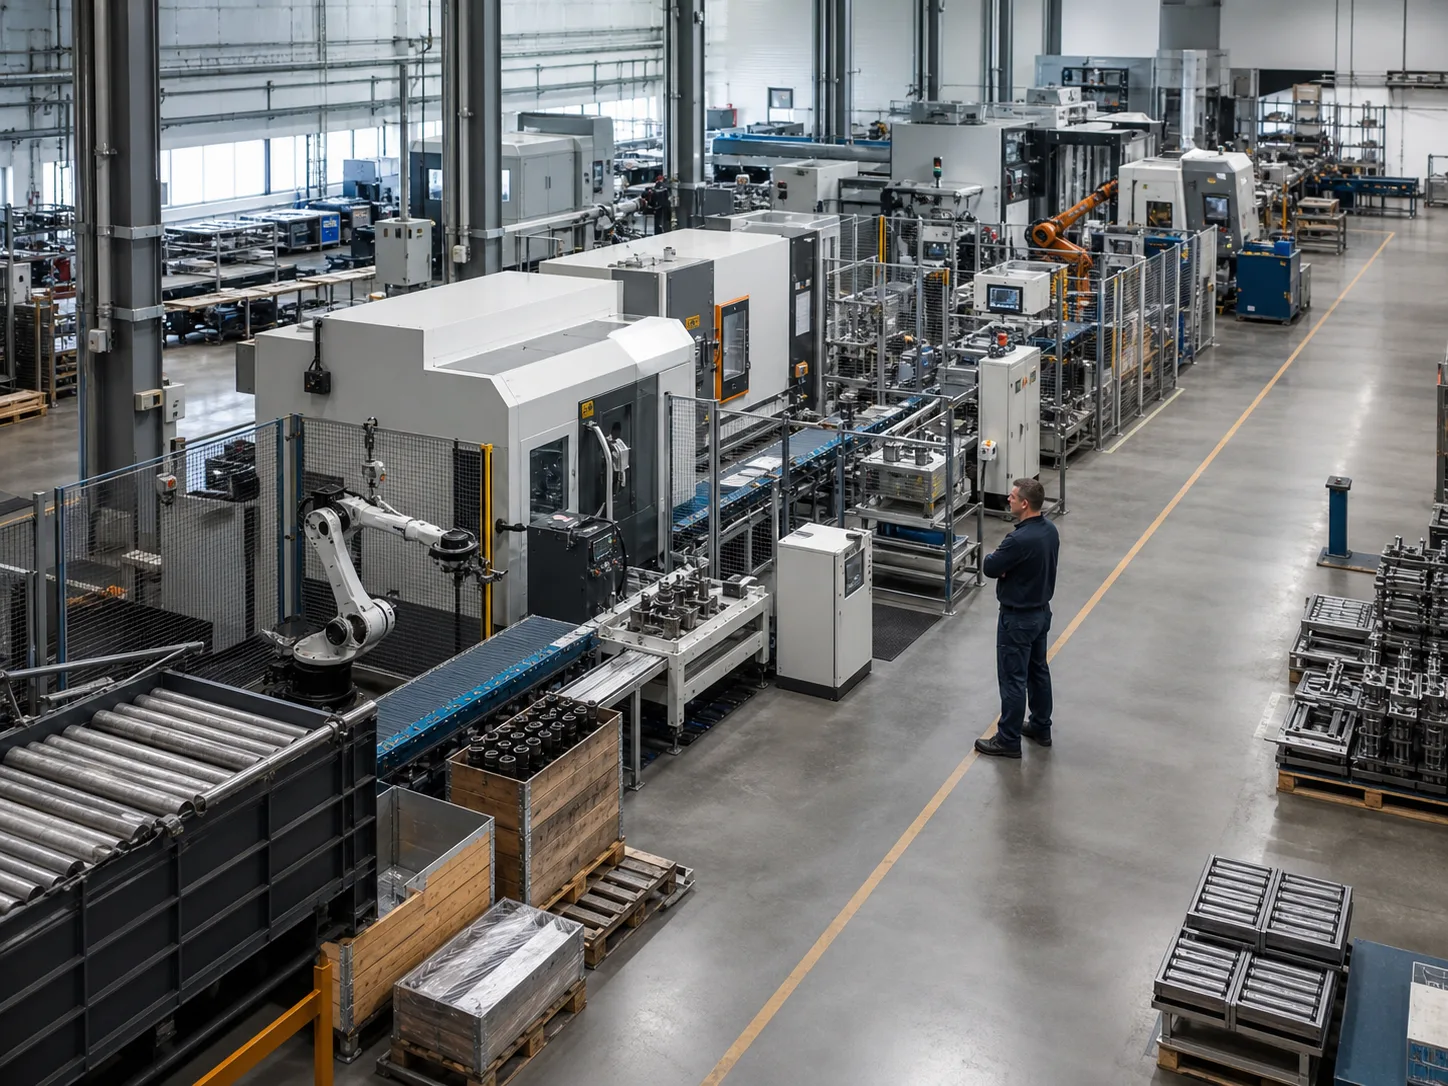
Setbacks, detours, and additional checks remain hidden in target processes and standard reports.
Parts pass through stations multiple times, while the root causes and affected variants are difficult to pinpoint.
Processing time alone does not explain why lead times for individual products or batches are increasing.
Without complete event paths, it is not possible to systematically compare unusual sequences with results.
Event Path
The analysis follows the actual process and preserves the product or batch context.
Station events are assigned to a part, order, or batch.
ID · Station · Timestamp
Events arranged in chronological order reflect the actual production process.
Transition · Order · Duration
Frequent and rare processes are analyzed by product, line, shift, or time period.
Variants · Filters · Frequency
Rework, wait times, and bottlenecks emerge as specific areas for improvement.
Loop · Wait time · Bottleneck
The product views combine the reconstructed process graph with a targeted analysis of notable paths.
What cycle time or waiting time is costing your line capacity?
The process graph shows stages, transitions, and the frequency of actual paths rather than just a planned sequence of events.
Every node and every connection can be traced back to specific events.
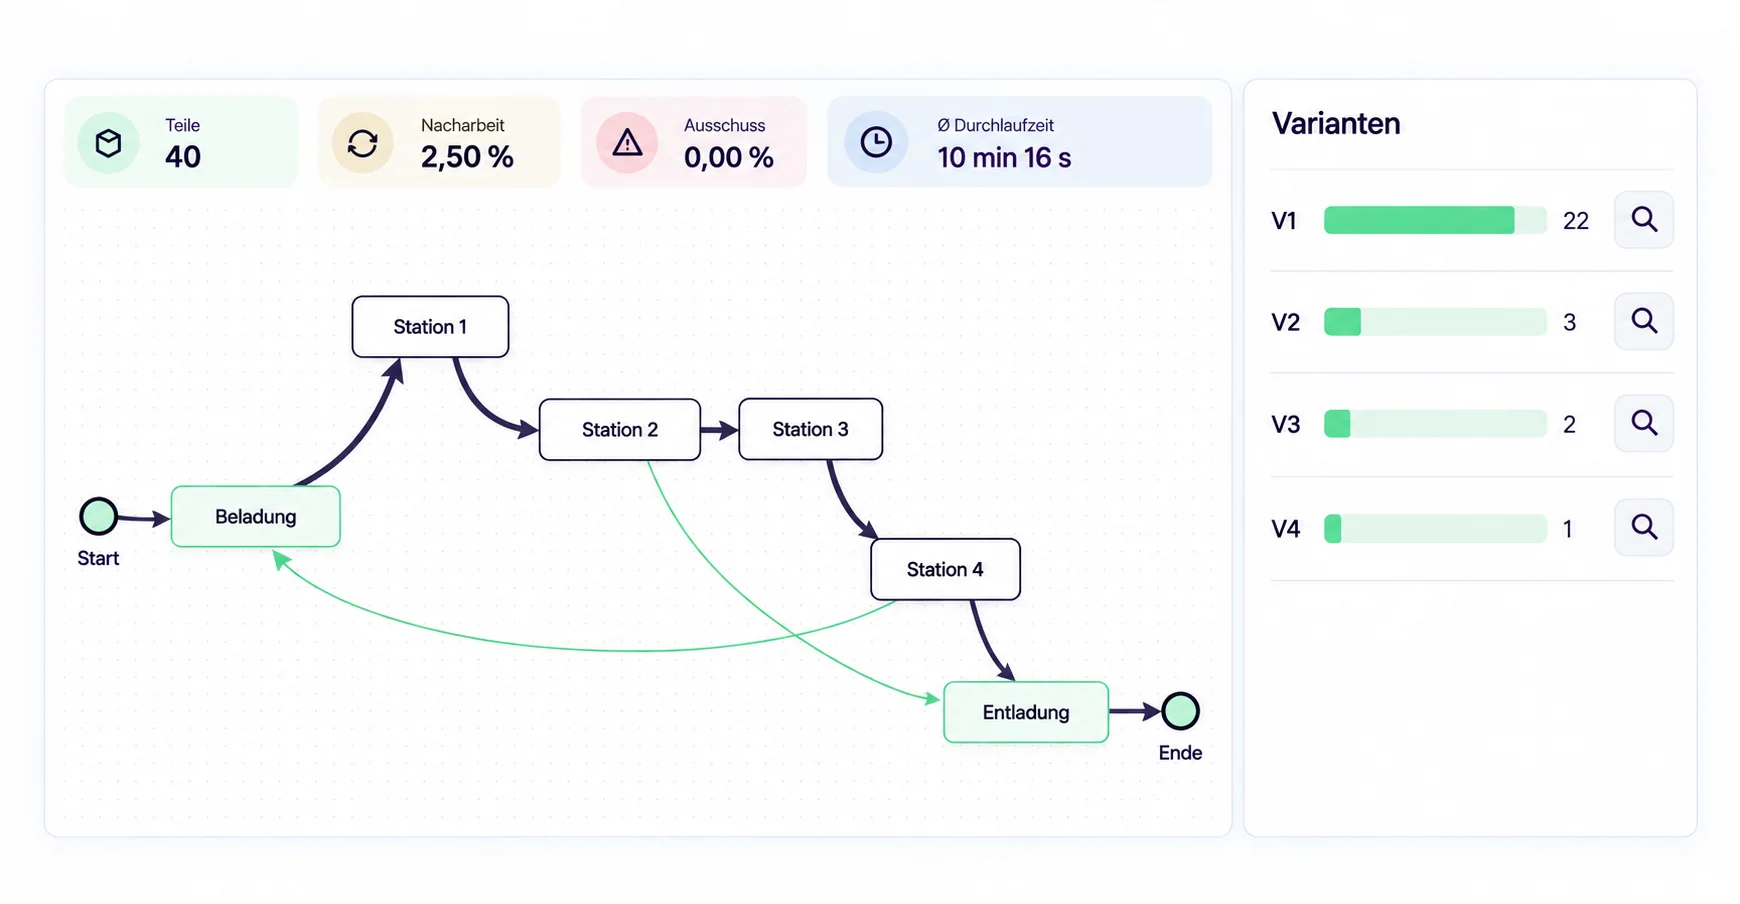
Processes, variations, and time losses can all be traced back to specific events.
Reconstructed from actual ward events that were recorded.
Filter by product, batch, line, shift, or time period.
Highlight rework, re-inspections, and additional tests.
Examine waiting, transport, and turnaround times in detail.
Data Set and Scope
We need chronologically ordered station or process events, as well as an ID that associates events with a part, order, or batch.
Process analysis reconstructs the path that parts or batches take through various stations. Status analysis, on the other hand, examines the temporal distribution and duration of machine statuses.
The actual event path highlights deviations from the expected sequence of events. Filters help narrow down the affected products, time periods, or shifts.
No. It is precisely branched processes, optional stages, backtracking, and rework loops that benefit from event-based reconstruction.
30-minute product demo
We'll show how a process graph is created from station events and how variations, rework, and wait times are minimized.
Product demo featuring a specific process scenario