Manufacturing Insights · Condition Analysis
Compare machine statuses. Understand downtime trends over time.
The status analysis standardizes plant-specific status values and shows when, for how long, and how often machines are producing, undergoing maintenance, being set up, or experiencing malfunctions.
Manufacturing Insights Add-on
Dieses Modul beantwortet eine konkrete Produktionsfrage auf der gemeinsamen industriellen Datenbasis.
When the same operating condition has a different name on each machine
Condition analysis establishes a common language for machine behavior and makes downtime comparable across assets.

- 01
Each control system refers to states differently
Raw data, codes, and manufacturer-specific terms prevent a reliable comparison across machines and production lines.
- 02
Time lost is grouped into categories
Production, malfunctions, setup, and maintenance are not consistently distinguished from one another or evaluated from a technical perspective.
- 03
Daily readings mask short, recurring phases
Overall availability does not indicate when adverse conditions occur or how often they interrupt operations.
- 04
The transition from condition to cause must still be done manually
Teams must search again for time windows in the report and attachment views to explain a loss phase.
From the raw state to the explainable loss phase
Mapping, temporal analysis, and technical context remain consistently interconnected.
- 01
Record Raw Data
Status logs from control systems and equipment are continuously imported.
Code · Timestamp · Asset
- 02
Depict consistently
System-specific values are assigned to defined higher-level states.
Mapping · Labeling · Evaluation
- 03
Compare Time Allocations
Timeline, distribution, and line KPIs show duration and frequency by machine and time period.
Timeline · Distribution · Line
- 04
Examine the loss phase
Highlighted time segments lead to the corresponding message and attachment context.
Segment · Report · Cause
State duration and technical context are interrelated
A weighted main view shows the availability basis; the supplementary view provides context for notable time windows.
Using Machine Statuses as a Traceable Time Basis
Standardized conditions provide a reliable basis for available and unavailable production time.
Consistently Evaluate Machine Behavior and Explain It in a Targeted Manner
Flexible State Source
Use machine status logs from various control systems and equipment.
Uniform Mapping
Group raw states for each asset into comparable higher-level states.
Timeline and Distribution
Examine the chronological sequence, duration, and proportion of each state for each machine.
Line KPIs
Aggregate status shares across systems to create an operational line view.
Context Drill-Down
Link notable segments to news reports and further analysis.
Classification and Data Set
What Sets State Analysis Apart from Other Modules
What conditions can be analyzed?
The relevant raw states are selected for each system and mapped to higher-level states that are technically understandable. This allows different machines to be compared.
How does condition analysis differ from OEE?
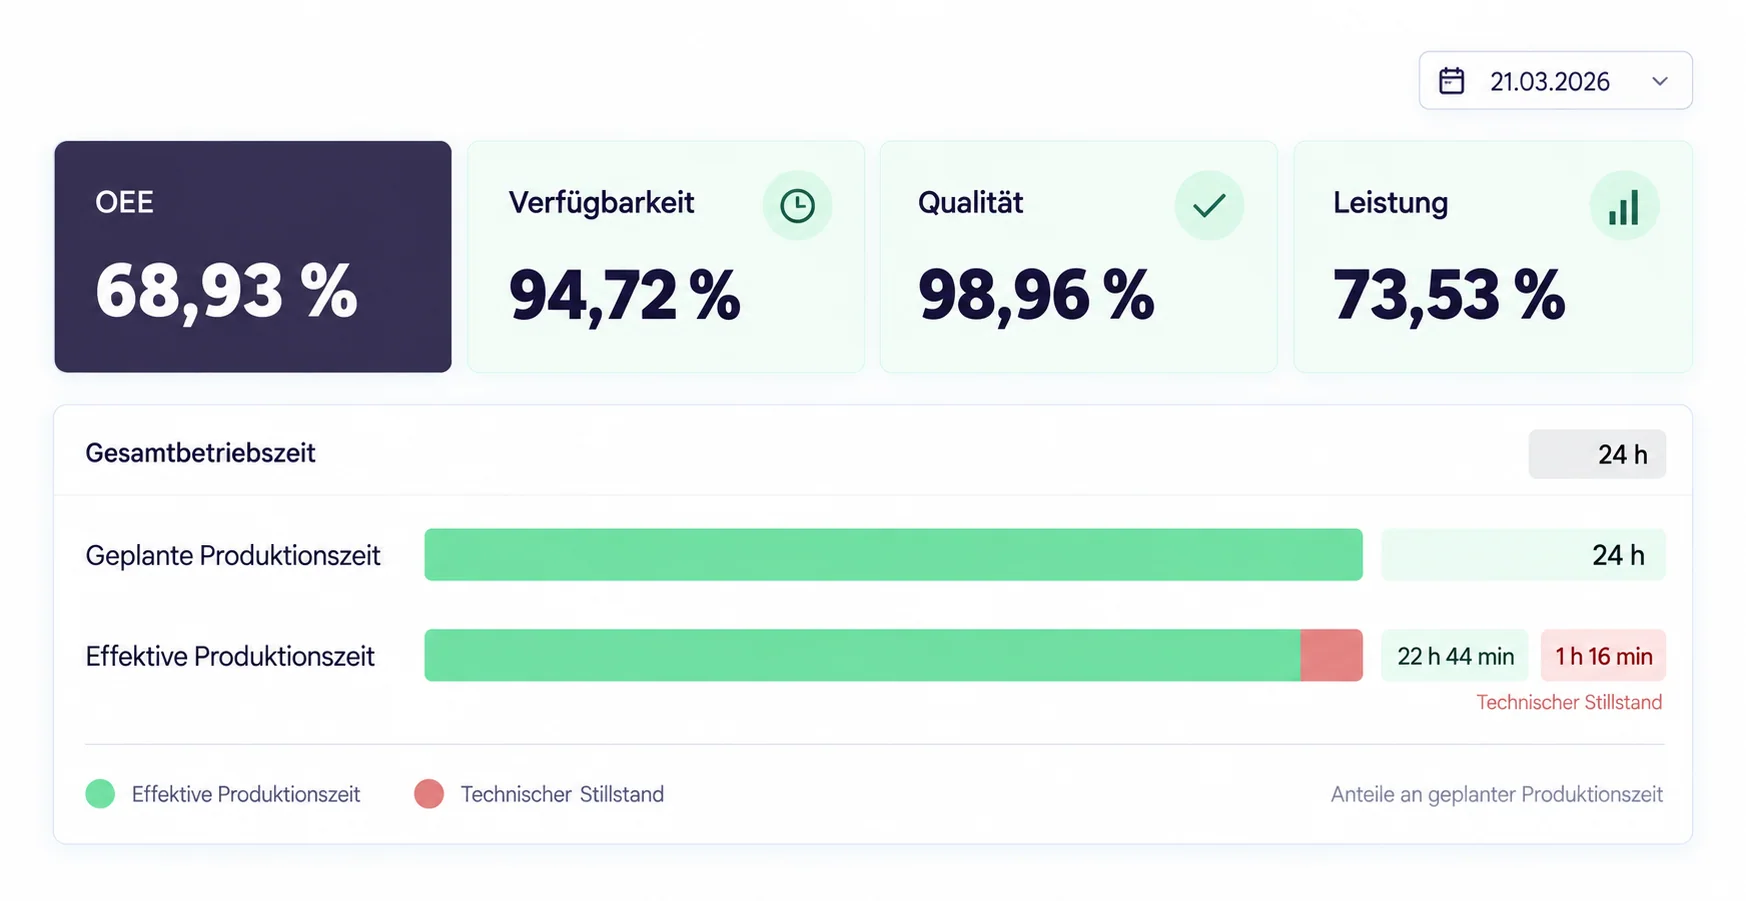
Condition analysis examines the sequence, duration, and distribution of machine states. OEE uses availability times, among other factors, and combines them with performance and quality factors to produce an overall metric.
How does it differ from process analysis?
Condition analysis examines the operational status of machines over time. Process analysis, on the other hand, traces the path of parts or batches through production stations.
Can machines with different status codes be compared?
Yes. Mapping to common higher-level states creates a basis for comparison, while the original raw state is retained for traceability.
30-minute product demo
Which machine statuses would you like to compare?
We show how raw states are standardized, analyzed in terms of their progression and distribution, and linked to availability and notifications.
Product demo featuring a specific use case