IoT Data Hub · Dashboards and Charts
Explore production data. Reveal patterns.
Charts and dashboards combine live signals, historical time series, and calculated metrics based on the same data source—for exploration, the shop floor, and the control room.
Part of the IoT Data Hub
Diese Fähigkeit arbeitet auf derselben Konnektivität, Semantik, Historie und Governance wie alle Data-Hub-Werkzeuge.
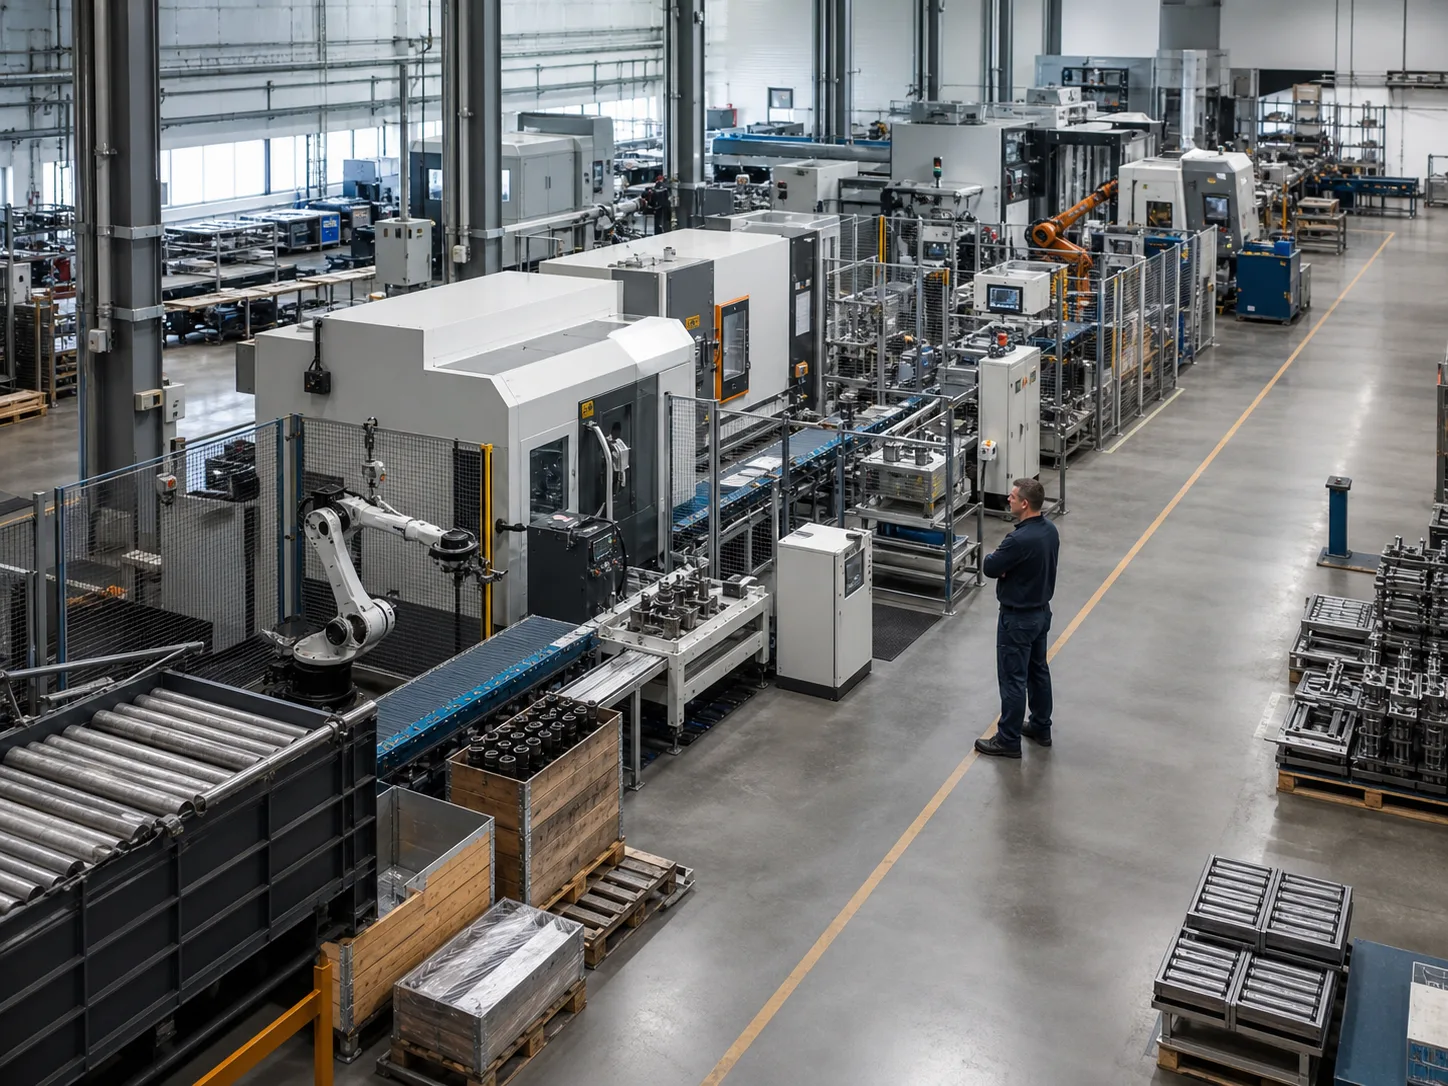
When a dashboard shows numbers but leaves the next question unanswered
The IoT Data Hub integrates the exploration and operational perspectives with the data model, production context, and access control.
- 01
Key metrics are derived from separate data sets
Manual exports and local tables result in conflicting views of the same production run.
- 02
Dashboards display metrics without production context
Without a line, station, product, or shift, a deviation remains visible but is difficult to classify.
- 03
Exploration and operational perspectives are separate
Analyses are generated in specialized tools and must then be rebuilt for the shop floor or control room.
- 04
Each target group receives an additional copy of the data
Technical teams, departments, and management no longer work on the same basis of data and access permissions.
From Machine Signal to Operational View
Exploration and the dashboard remain part of the same data flow—without any disruption between analysis and use.
- 01
Select relevant data
Compile live signals, stored time series, and calculated metrics from the shared data model.
Asset · Signal · Time Period · Metric
- 02
Exploring Connections
Examine trends, outliers, and correlations using the appropriate visualization for each.
Time Series · Heat Map · Table · Correlation
- 03
Compose an Operative View
Link relevant individual views to a dashboard for a specific role or task.
Shop Floor · Control Room · Department
- 04
Deploy securely
The dashboard and data access remain linked to roles, platform context, and the ongoing data feed.
Roles · Approval · Real-Time Updates
A work environment for exploration and operational perspectives
Large, differently weighted product views present the dashboard, exploration, and configuration as distinct work modes.
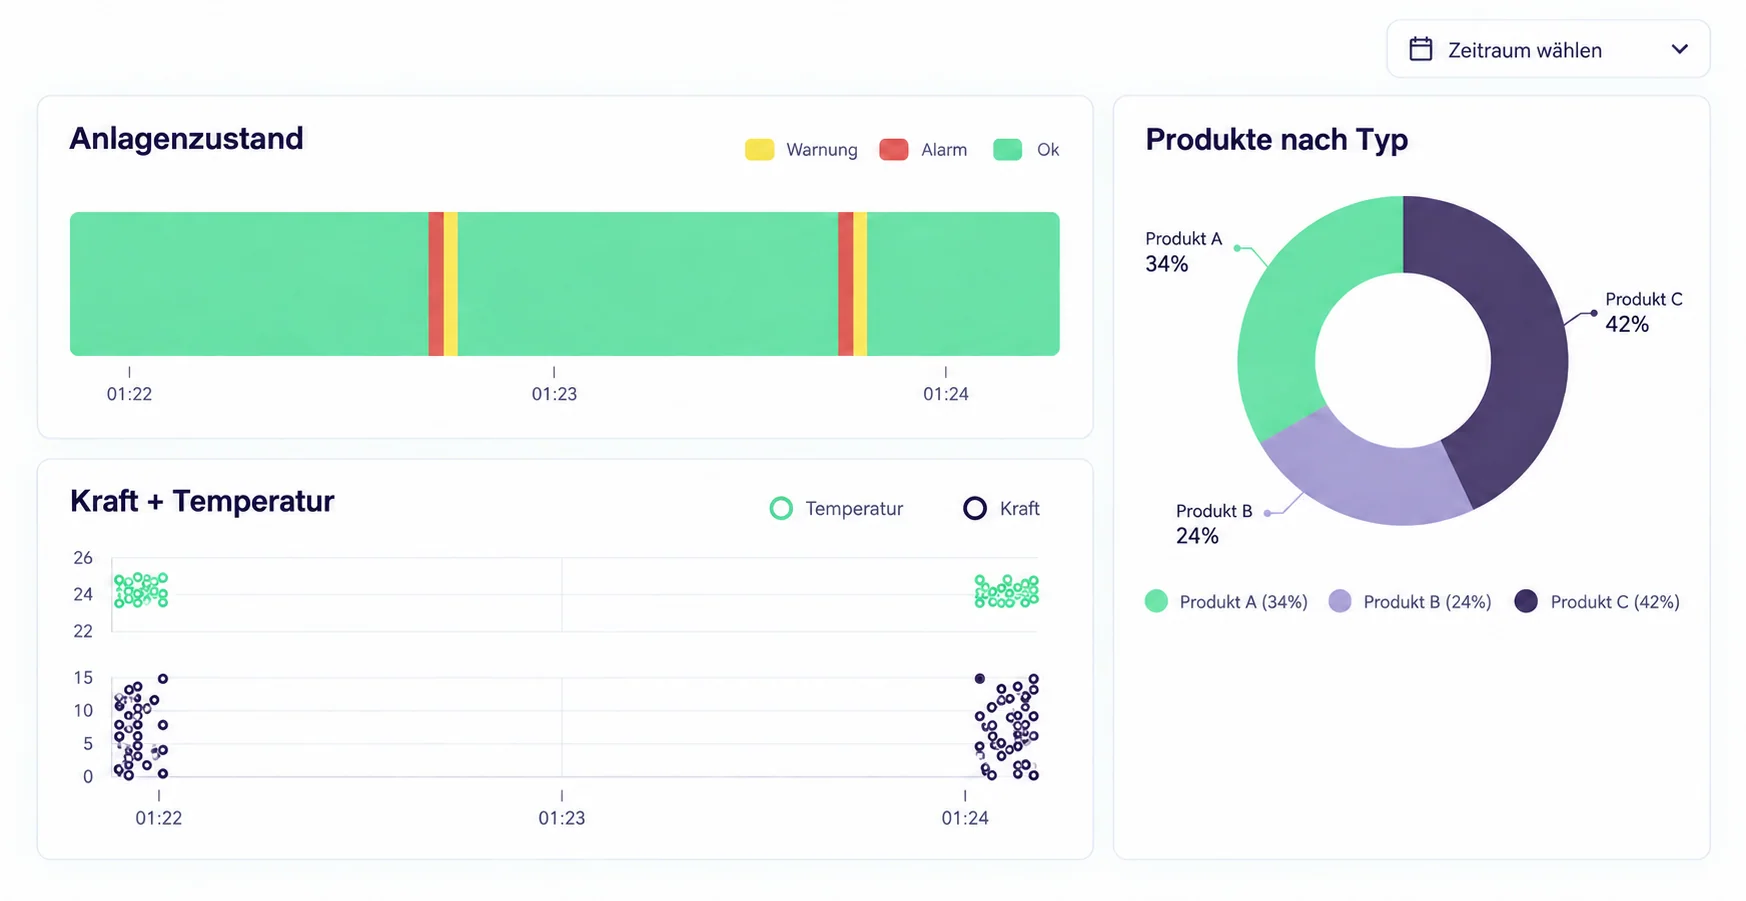
Consolidate the most important production signals into a single view
Dashboards aggregate key metrics and trends for a specific operational task without creating a separate copy of the data.
The Same Data—Tailored to the Question, Role, and Situation
Live and Historical
Use real-time signals and stored time series in an analysis environment.
Charts and Tables
Visualize data relevant to the operational question and compare it in a structured manner.
Heat Maps and Correlations
Examine patterns and relationships based on signals, time periods, and process characteristics.
Common data model
Ensure that visualizations remain consistent with the plant, line, and process context.
Role-Based Access
Share views with technical teams, departments, and management as appropriate.
Exploration and Operations
How Dashboards and Visualizations Are Categorized
What is the difference between a chart and a dashboard?
A chart examines or explains a single relationship. A dashboard combines multiple relevant views into a persistent operational view tailored to a specific role or task.
Can live and historical data be displayed together?
Yes. Visualizations can use real-time signals, stored time series, and calculated metrics from the IoT Data Hub, all based on a common data source.
How do dashboards differ from manufacturing insights?
Dashboards and charts are flexible tools for exploration and visualization. Manufacturing Insights includes preconfigured modules that already provide a subject-matter-specific framework for specific production questions and improvement processes.
Does data have to be copied for each view?
No. Views rely on the platform's shared data model and access rules. This ensures consistency across visualizations, analyses, and other applications.
30-minute product demo
What kind of production view would you like to set up?
We'll demonstrate live how platform data can be used to create an exploratory analysis and a dashboard view that can be used on an ongoing basis.
Product Demo Based on Your Specific Data Query