Production Analysis
The line is running, but there are missing parts at the end. Or output is on target, while rework is tying up more and more capacity. Production analysis reveals which products and production conditions are behind such trends. It links quantity and quality metrics to cycle times and process parameters without having to compile the data anew for each question.
Considering Yield and Quality Together
The production view displays the recorded quantities and their quality distribution for the plant in question and the selected time period. This allows you to determine whether a decline in the quantity of good parts is due to lower production or to a higher proportion of defective parts.
First, consider the absolute quantities: How many units were produced, and how many of them are good, scrap, or scheduled for rework? The respective percentages then help you compare time periods with different production volumes.
Here’s an example:. Out of 1,000 parts produced, 50 parts requiring rework account for five percent. With 2,000 parts, those same 50 parts requiring rework account for only two and a half percent. The rate has decreased, but the absolute amount of rework remains unchanged for now. Both metrics are needed if you want to free up capacity.
Which quality classes are displayed depends on the status values in your production log and their assignments.
Highlighting the Differences Between Products
Production data can be divided into comparable groups based on the configured product characteristics. For example, a part type may reveal that an increased scrap rate primarily affects a specific variant. Additional characteristics, such as a tool, can supplement the analysis if they are present in the data and have been set up for evaluation.
This is particularly helpful when the product mix changes. A total value may increase because more complex variants were manufactured. If you compare the same variants, you can see whether their production behavior has actually changed.
For the investigation, this means: first narrow down the affected product group, then examine its lead times, quality metrics, and process conditions. This allows you to focus your further work on the parts where improvements can make a difference.
Examine cycle times and variation
Cycle time analyses help identify slower processing and irregular operations. The time series shows when the values change. Distributions reveal whether many parts are being processed slightly more slowly or whether a few outliers are skewing the mean upward.
| Observation | Next relevant comparison |
|---|---|
| The cycle time increases over time. | Examine the same product before and after the change begins. |
| The average value remains similar, but individual cycles become significantly longer. | Examine the variation and the affected parts. |
| One product variant runs slower than another. | Take into account the product-specific target time and planned processing time. |
| Despite the short processing time, fewer parts are produced. | Look for patterns in the state analysis following interruptions and waiting periods. |
The significance of the recorded time value is important: the processing time for a part, the interval between two completion notifications, and the total lead time through a line all describe different things. The evaluation uses the time information provided by your data model.
Combining Process Parameters with Quality
When process parameters are recorded along with the production event, unusual results can be investigated in relation to the processing conditions. These parameters may include, for example, force, temperature, pressure, or torque.
Time series show when a parameter changes. Distribution views help you compare stable and outlier groups. This allows you, for example, to investigate whether rework parts are more frequently found within a specific range of values or whether a change occurs only with a specific tool.
The analysis thus provides a concrete approach for the technical review. You should consult with the process managers to determine whether the parameter itself is the cause or whether it changes in conjunction with another influencing factor.
Example: Limiting rework at a test station
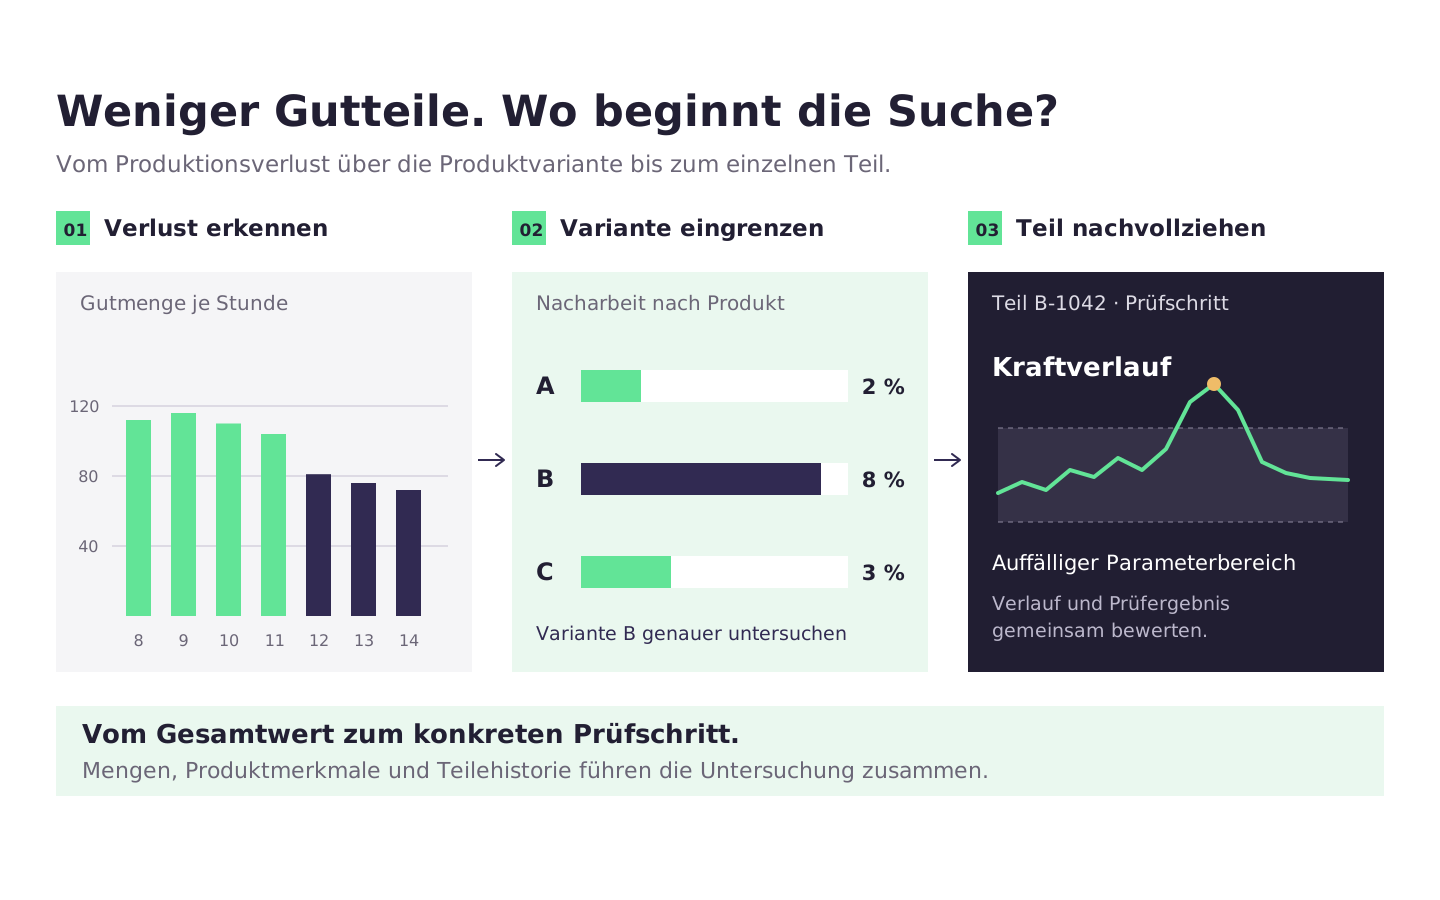
Suppose the rework rate for a line has increased. Instead of checking all of the line's process values, proceed step by step:
- Determine the scope. Select the plant and time period, and review the yield, rework, and scrap. Compare the quantities and percentages.
- Narrow down the product group. Break down the data based on the product attribute you set up. Does the change affect all variants or just one?
- Compare process conditions. Examine existing cycle times and parameters for the affected variant. Look for differences between parts with and without defects.
- Track individual processes. In addition, check the process analysis to see whether the affected parts undergo additional inspections or rework.
- Evaluate the measure. After making a change, repeat the comparison for the same variant. The key factor is whether rework is reduced while maintaining the yield.
This turns “Re-work is increasing” into a specific question about a product and its processing. This saves time spent searching and facilitates coordination with Quality and Production.
Set Up the Data Set and Counting Method
The foundation is the production log. It assigns production events to a piece of equipment, a part, a time, and a status. Cycle times, product characteristics, activities, and process parameters supplement this foundation.
When setting up the system, specify what is being counted. A data record can describe a finished part or a single processing step. If a part passes through a station twice, that counts as two processing steps, but not as two different parts. Similarly, it must be clear how a part that was initially defective but was subsequently successfully reworked should be evaluated.
Verify the count using a known time period and a few part identifiers. This ensures that production and quality teams are working with the same quantities. To classify losses at the equipment level, OEE supplements the production analysis with availability and performance metrics.