Process Analysis
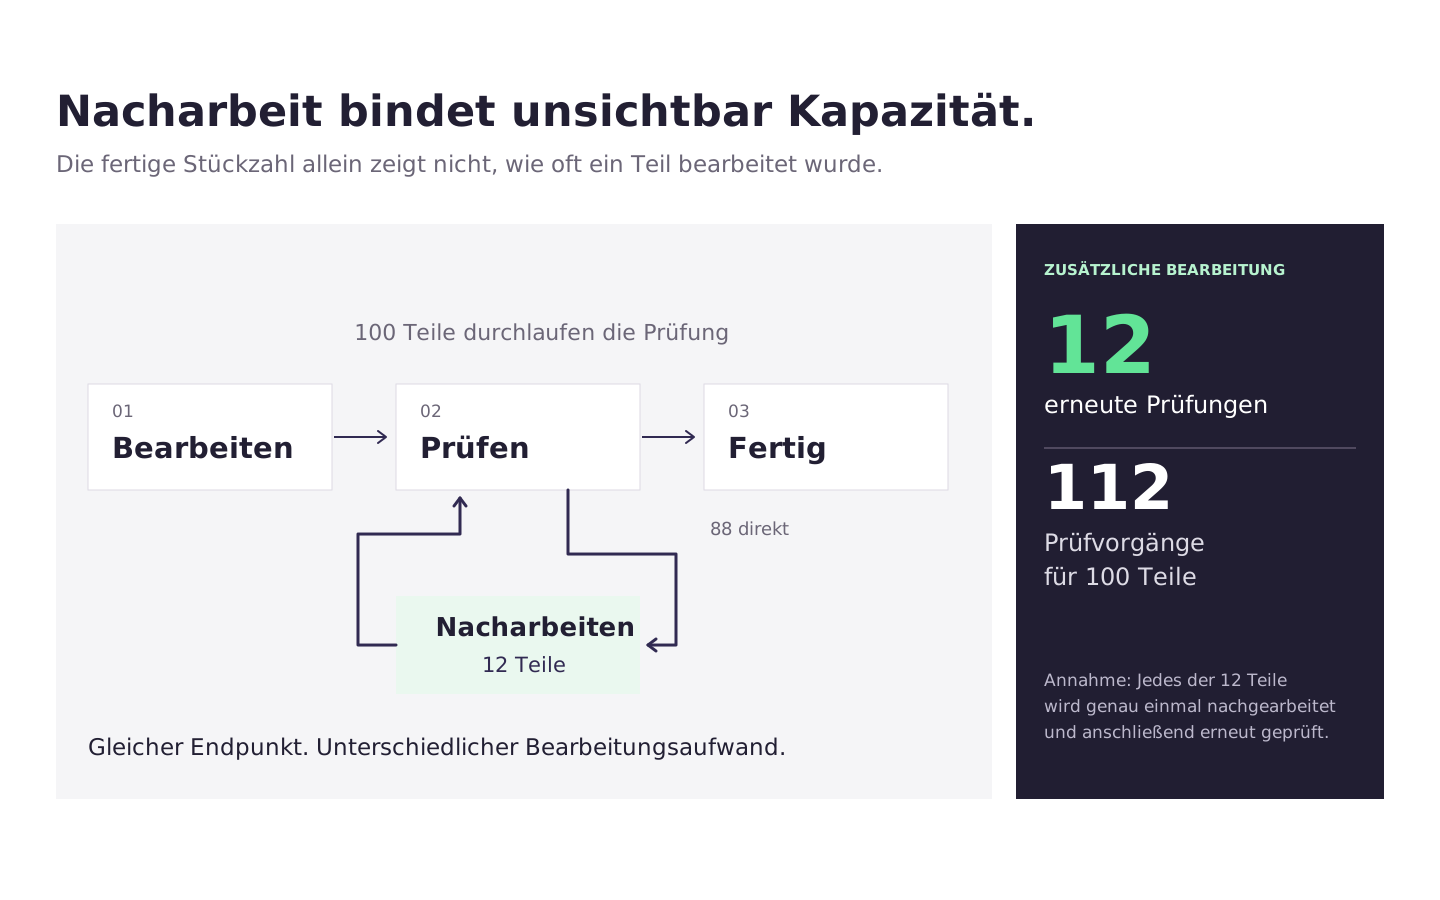
Some parts go through the planned processing, are inspected, and leave the line. That is how the planned process looks. In practice, additional inspections, rework, and repeated processing are added. These steps tie up capacity without being reflected in the final output.
Process analysis reconstructs the actual path of the parts based on the recorded production events. It shows which processes occur, how frequently they occur, and which parts are affected. This allows you to specifically investigate rework and long lead times.
View the actual sequence in the process graph
The process graph depicts recorded activities and their transitions. The graph is generated from the existing events. It thus shows the actual paths that components have taken.
You can see the main path that is frequently taken, as well as branches, repeated steps, and backtracking. This is also helpful for processes with optional checks or multiple permissible paths: the actual sequence becomes visible without reducing it to a single linear sequence.
Compare the graph with the expected process. Which connections are intended? Where do additional paths appear? This will give you an overview before you examine individual variants in more detail.
Compare Process Variants
A process variant describes a specific sequence of activities. Parts with the same sequence belong to the same variant. Selecting variants helps break down the overall process into specific workflows.
A simplified example:
| Variant | Process described | Research question |
|---|---|---|
| A | Edit → Review → Mark as Complete | Is this the intended standard procedure? |
| B | Edit → Check → Rework → Check → Mark as Complete | How many parts require this additional processing? |
| C | Edit → Check → Check → Mark as Complete | Is this the second check as planned, or an unexpected repeat? |
Frequency indicates how common a process is. Lead times and quality status help assess its impact. A frequent variant may be part of the regular process. A rare variant, on the other hand, may involve time-consuming rework or a significant quality issue.
Take the configured product characteristic into account: If different product types are intentionally routed through different inspection paths, this difference does not necessarily indicate a process error.
Check the affected parts and their history
The parts list links a variant to the parts it actually involves. The variant details include parts and status distributions as well as individual histories.
This allows you to track anomalies in specific cases: What activities were performed? In what order? With what result? When a single item goes through the same step multiple times, this repetition remains visible in the history.
This view is also helpful when coordinating with production. Instead of simply discussing an unusual process path, you can refer to a specific part and its recorded machining steps.
Examine the time between steps
Long lead times do not occur only during processing. A part may be waiting, being transported, or held in a buffer between stations. The time data associated with these events helps identify problematic sections.
Be sure to distinguish between the measured quantities:
- Processing time: The time required for an activity when the relevant start and end information is available.
- Time between activities: The time interval between recorded events. This may include waiting and transportation.
- Lead time: The time spent within the process boundary under consideration, from the specified start to the end.
A large time gap between events initially indicates where time is being lost. You can determine whether the part is actually waiting there or whether an unrecorded work step is taking place by reviewing the process flow. The state analysis provides additional insight into the behavior of the machines involved.
Add process parameters
Supplementary statistical and graphical views are available for existing process parameters. This allows you to examine outliers not only based on their order but also based on their processing conditions.
For example, if, upon repeated testing, parts are found to fall within a specific parameter range more frequently, this raises a specific question for those responsible for the process. Whenever possible, compare the same products so that intended differences between variants do not skew the analysis.
Example: Additional tests tie up capacity
The yield remains stable, but the testing station is under greater strain. Your team suspects that parts are being retested more frequently.
- Define the process. Select the relevant facility, an appropriate time period, and a comparable product group.
- View variants. Search for processes in which the inspection activity occurs multiple times.
- Determine the scope. Check how many parts these variants go through and what their quality status is.
- Track individual parts. Examine a few test histories. Is there rework between tests, or are the parts retested without further processing?
- Compare conditions. Include existing process parameters and consult with the production department to determine how many repetitions are planned.
- Re-evaluate after making a change. Check to see if the percentage of unexpected repetitions decreases and the quality remains stable.
This makes it clear whether a measure frees up processing capacity, even if the number of finished units does not change at first. You can also review quantities and quality rates in the production analysis.
Set Up Events and Process Limits
Process analysis uses the assigned production and activity data. Each event requires a time reference, an activity, and a unique assignment to the part in question. If start and end events are recorded, their relationship to one another must be clear.
In the configuration, you can specify a product characteristic as well as the required start and end activities. These settings determine which history entries are included in the analysis. Parts that were started before the selected time period or will not be completed until after it may otherwise appear incomplete.
Also, be sure to watch for reused identifiers, such as those used for workpiece carriers. Events involving different parts must not be linked in a way that creates the appearance of a shared sequence. Timestamps from the relevant sources must match so that the sequence and duration are correct. The basics of this are described in the production log.