OEE
A machine can run for a long time and still produce too few good parts. It can operate quickly and yet generate a lot of scrap. OEE therefore combines three perspectives: availability, performance, and quality.
The OEE view helps you identify the area with the greatest loss and focus your further investigation. The overall value shows the trend. The three factors indicate where you should take a closer look.
Understanding the Three Factors
OEE = Availability × Performance × Quality
The factors are multiplied together as proportions. Each factor represents a different portion of the production losses.
| Factor | What question does it answer? | Basic technical model |
|---|---|---|
| Availability | How much of the planned production time was the plant able to operate? | Operating time / planned production time |
| Performance | How much was produced during the runtime relative to the target speed? | Theoretically required production time / actual runtime |
| Quality | What percentage of the production under consideration is good? | Good parts / Total quantity |
The conditions, times, and quantities used for this purpose are configured for the plant. A common definition is important: Only then can production, quality, and maintenance evaluate the same situation.
Availability: Identifying Lost Production Time
Availability compares the operating time to the planned production time. A low value indicates that the analysis should focus on interruptions and downtime.
The state analysis shows how time is allocated to production, waiting, setup, or breakdowns. You can then use the event analysis to examine any sections that stand out in more detail.
During setup, specify which time periods are considered scheduled production and how interruptions are handled. A scheduled break outside of production hours has a different meaning than an unscheduled stoppage during a production order. The classification of setup times must also align with the agreed-upon calculation method.
Performance: Identify Causes of Slower Production
The performance analysis compares the actual runtime with the time that would be required to produce the same quantity based on the specified target cycles. This reveals any losses that occur during the runtime.
If the value is low, examine cycle times, output, and unusual processing steps in the production analysis. If you suspect there are additional steps or repetitions, the process analysis provides further insight into the actual workflows.
When dealing with different products, selecting the appropriate target times is crucial. A more complex variant should not be evaluated based on the target cycle of a simpler product. The configured product characteristic helps distinguish between part types for the calculation.
Quality: Evaluating the proportion of usable production
The quality factor compares the good output to the total output under consideration. This reveals what proportion of production directly contributes to the desired result.
If there are quality issues, go to the production analysis and look at the affected product groups and their process parameters. This will help you determine, for example, whether scrap or rework primarily affects a specific variant.
Define how reworked parts are handled. A part that passes inspection after a second run still consumed additional capacity. To ensure a transparent evaluation, the quantity of good parts, rework, and re-machining must be clearly recorded at the same counting point.
Calculation Example: From the Total Value to the Starting Point
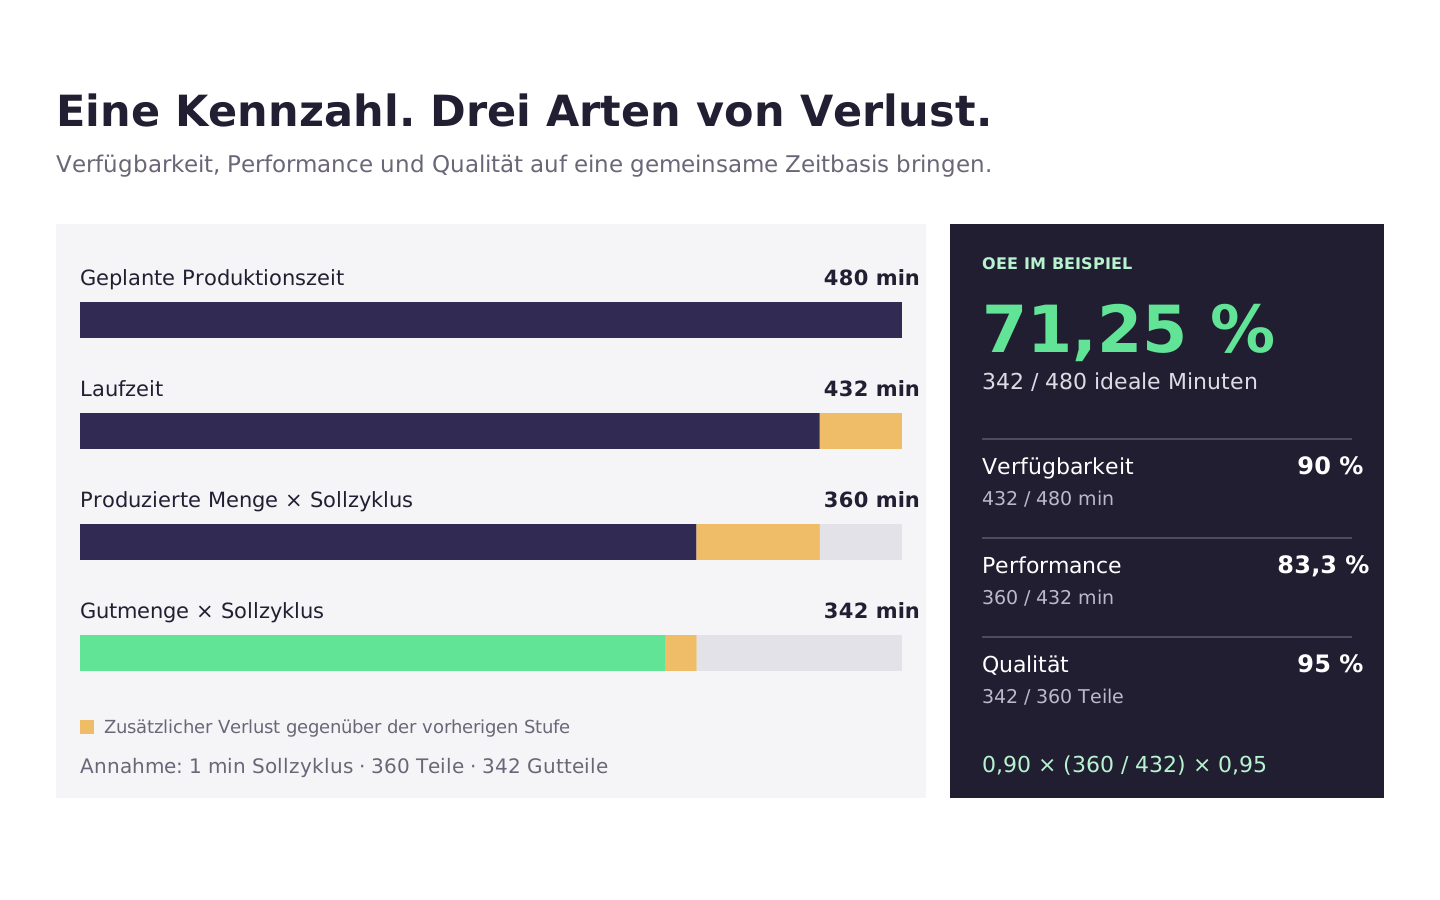
A machine is supposed to produce 480 minutes' worth of output during a given period. It runs for 432 of those minutes. With a target cycle time of one minute, 360 parts are produced, of which 342 are good. For this simplified example, the following applies:
| Factor | Calculation | Result |
|---|---|---|
| Availability | 432 / 480 minutes | 90% |
| Performance | 360 × 1 minute / 432 minutes | 83.3% |
| Quality | 342 / 360 parts | 95% |
| OEE | 0.90 × (360 / 432) × 0.95 | 71.25% |
The example illustrates three different types of losses: 48 minutes of downtime, lower output during operating time, and 18 parts that did not meet quality standards. Performance is the lowest factor here. A sensible starting point is therefore to examine cycle times and production processes. At the same time, it remains evident that downtime and quality-related losses also exist.
The figures are provided to explain the calculation. Which improvement is most worthwhile depends, in addition, on the effort required and the impact of a specific measure.
Set up the calculation for a system
The OEE view has separate configurations for the basic calculation as well as for availability, performance, and quality. This also includes the product characteristic used to distinguish between part types.
Before using the system, please review the following points:
- Scope of consideration: Are you evaluating a single station or the entire line?
- Time Basis: What time is allocated for production, and which machine statuses count as runtime?
- Billing Basis: Which billing cycle applies to which product and which meter account?
- Quality Basis: What counts as a good part, scrap, or rework, and how is multiple processing handled?
Review a specific time period based on the recorded quantities and times. This will quickly reveal whether, for example, a state assignment is missing or a target cycle does not match the product. An unexpectedly high performance value is initially a reason to check the time base, count, and target value.
Compare the factors together after a step
In addition to OEE, always consider its three factors. A shorter processing time is not an improvement if it results in significantly more scrap. Conversely, a targeted process change may initially take a little more time but still increase the yield.
Compare the same facility using consistent definitions and take the product mix into account. Total values across multiple time periods are calculated based on the underlying quantities and time periods; simply averaging individual percentage values can skew the result.
Add the specific impact to the metric: How many minutes of downtime were avoided? How many additional good parts were produced? How much rework was eliminated? This turns a change in percentage into an improvement that your team can understand in the context of daily operations.