Manufacturing Analytics Copilot
For a small number of systems, it’s still possible to check key metrics regularly on your own. With each additional system, product variant, and analysis, this becomes more time-consuming. Anomalies go unaddressed, even though the data needed to investigate them is already available.
The Manufacturing Analytics Copilot handles the routine analysis of available data. It analyzes the data in the background and presents relevant anomalies in an easy-to-understand format. Your team can see which equipment requires attention and use that time to focus on the actual investigation.
Identify anomalies without having to open each view individually
The Copilot can analyze the structured data from the activated Manufacturing Insights modules on its own. This means that a separate question in the chat is not required for every analysis.
He looks for anomalies and recurring patterns within the existing plant context. Depending on the data provided, these might include, for example, changes in quality metrics, unusual machine conditions, or recurring error message patterns.
The benefits increase with the number of systems being analyzed: Your team doesn’t have to divide its attention equally among all views. It receives prioritized areas of focus and can address the most notable developments first.
What data is included
Copilot uses the same system, data, and permissions infrastructure as the Insights modules. Its analysis is based on the activated modules and the available data.
| Data context: | Which study it supports: |
|---|---|
| Production Analysis and OEE | Interpreting Changes in Output, Quality, and Performance Factors. |
| Event Analysis | Investigate recurring events and unusual event patterns. |
| State Analysis: Identifying Changes in Productive and Unproductive Times. | |
| Process Analysis and Part Histories | Examine unusual processes and repeated machining operations in the context of parts. |
This allows an anomaly to be investigated in conjunction with other available information. For example, if quality data is available but no process parameters are recorded, the Copilot can identify a change in quality. However, this does not automatically provide it with the missing processing conditions.
Receive Results as Data Stories
Relevant results are presented as "" Data Stories. Each story links the description of the anomaly to the analytical context and supporting evidence. This allows you to understand which asset and which time period are affected, as well as the basis for the classification.
This saves time when preparing for an analysis. Instead of first compiling metrics and events from multiple views, you can start with a report that’s already been prepared.
Read the summary and supporting materials together. The following three questions will be helpful as you continue working on this:
- What, specifically, has changed?
- Which facilities, products, or time periods are affected?
- What is the next step our team should take based on this observation?
In Data Stories, you can supplement the case with your own process knowledge, charts, and the next steps in the solution. This ensures that the investigation remains clear and understandable to other colleagues and the next shift.
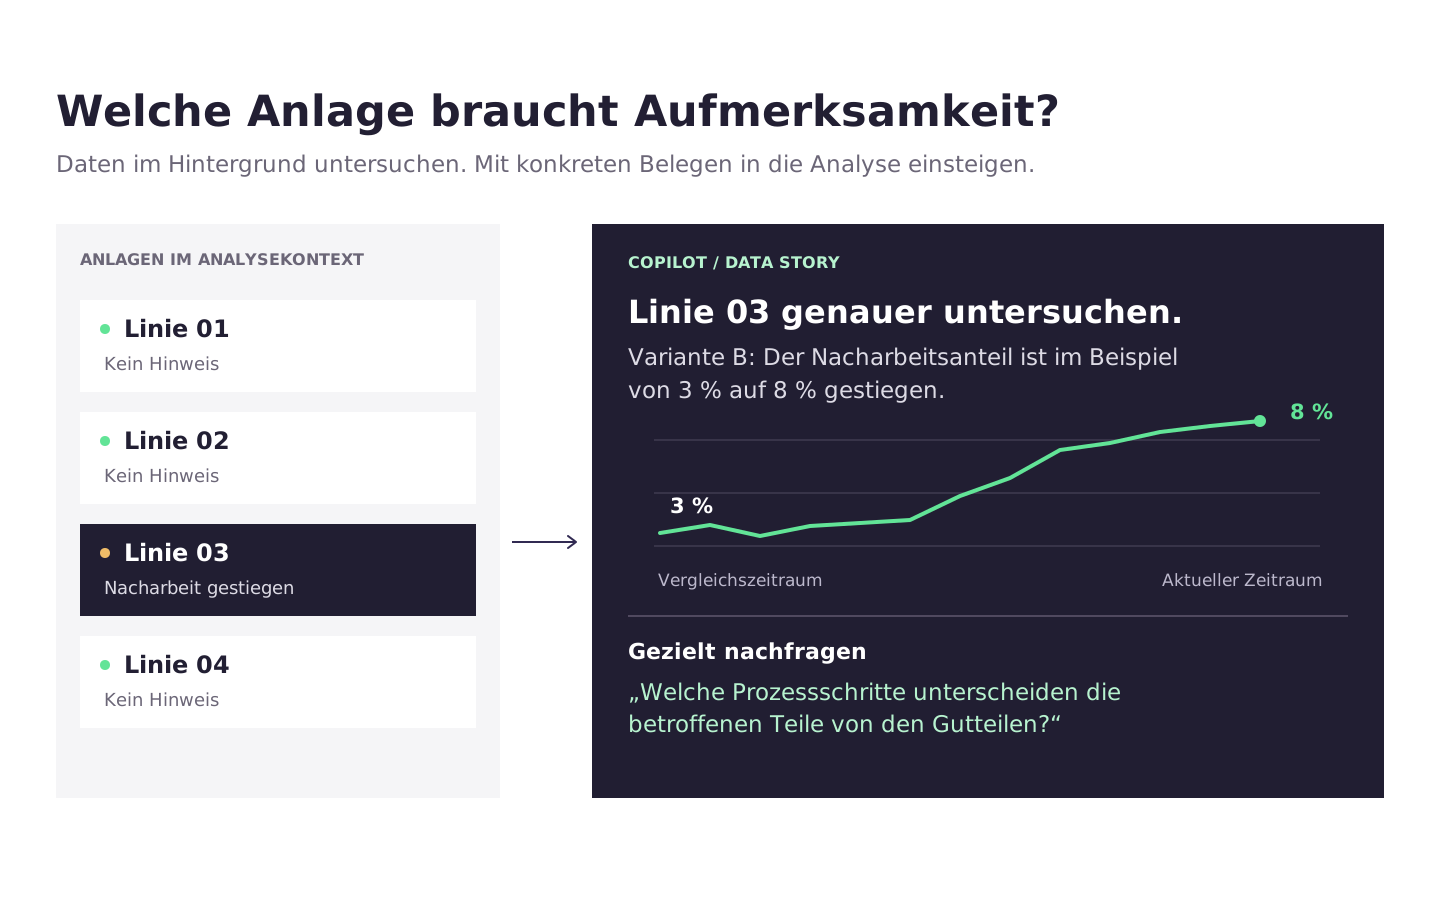
Ask specific questions in the chat
Context-aware chat helps you delve deeper into a finding. You can ask follow-up questions, narrow down the investigation, and navigate from the answer to related Insights views.
Formulate your questions as closely as possible to the observation at hand. Examples of follow-up questions include:
| Starting point | . For inquiries |
|---|---|
| More rework on a production line | “Does the change affect all products, or mainly one variant?” |
| Recurring Downtime Periods | “Which alerts occur repeatedly during these time periods?” |
| A notable process variation | “What additional steps do the affected parts go through?” |
| A difference between time periods | "Is the change also visible when comparing the same product group?" |
| A Proposed Explanation | “What data supports this explanation, and what do we need to check at the facility?” |
The questions that can be answered depend on the available data context. The linked analysis views then allow you to drill down to the underlying trends or events.
Example: Increasing rework at one of many plants
Your team oversees several production lines. There isn't enough time to conduct a complete daily review of all quality and process metrics.
Here's what a possible workflow with Copilot might look like:
- Identify anomalies. Copilot analyzes the available quality data and presents an anomalous trend as a data story.
- Understanding the scope. Your team will review which facility, time period, and quantities are the basis for the notice.
- Narrow down the search in the chat. They are asking whether the change primarily affects a specific product group.
- Examine the details. In the linked analysis views, review the relevant production data and, if available, process parameters or part histories.
- Resolve the issue on site. Discuss the specific case with the process managers and determine a course of action.
- Record the results. Document the findings and, after implementation, compare the rework for the same product group again.
The time saved comes mainly before the technical decision is made: less time spent sifting through views, less data to compile, and getting to the heart of a specific problem more quickly.
Use Copilot for Your Business
Start with modules whose data your team is already familiar with. A clear line of inquiry makes it easier to evaluate the initial results—such as recurring downtime or an increase in rework.
First, verify that the asset assignments, time periods, and key metric definitions are correct. Then, in your day-to-day work, assess whether the Data Stories address relevant issues and whether inquiries lead more quickly to a concrete investigation. Based on this, you can expand their use to additional assets and data contexts.
Copilot handles the analysis and data preparation. Your team remains responsible for investigating the technical causes and deciding on changes to equipment or processes. The simultaneous occurrence of two events is a valuable clue, but it does not yet prove a causal relationship.
Therefore, when evaluating the benefits, it is not the number of alerts that counts, but rather the cases handled: How much search time is saved? How quickly can an affected system be pinpointed? What improvements was your team able to derive from this?