Why Is Rework Increasing? Investigating Production Data with AI
Rework on a production line is increasing. At the morning meeting, several explanations come up: a different material batch, a worn tool or a changed setting. The quality metric shows the change. It does not yet tell us which explanation is correct.
The investigation requires quality data, product variants and process conditions to be considered together. This example shows how that works, which data is needed and where AI can help.
What exactly has changed?
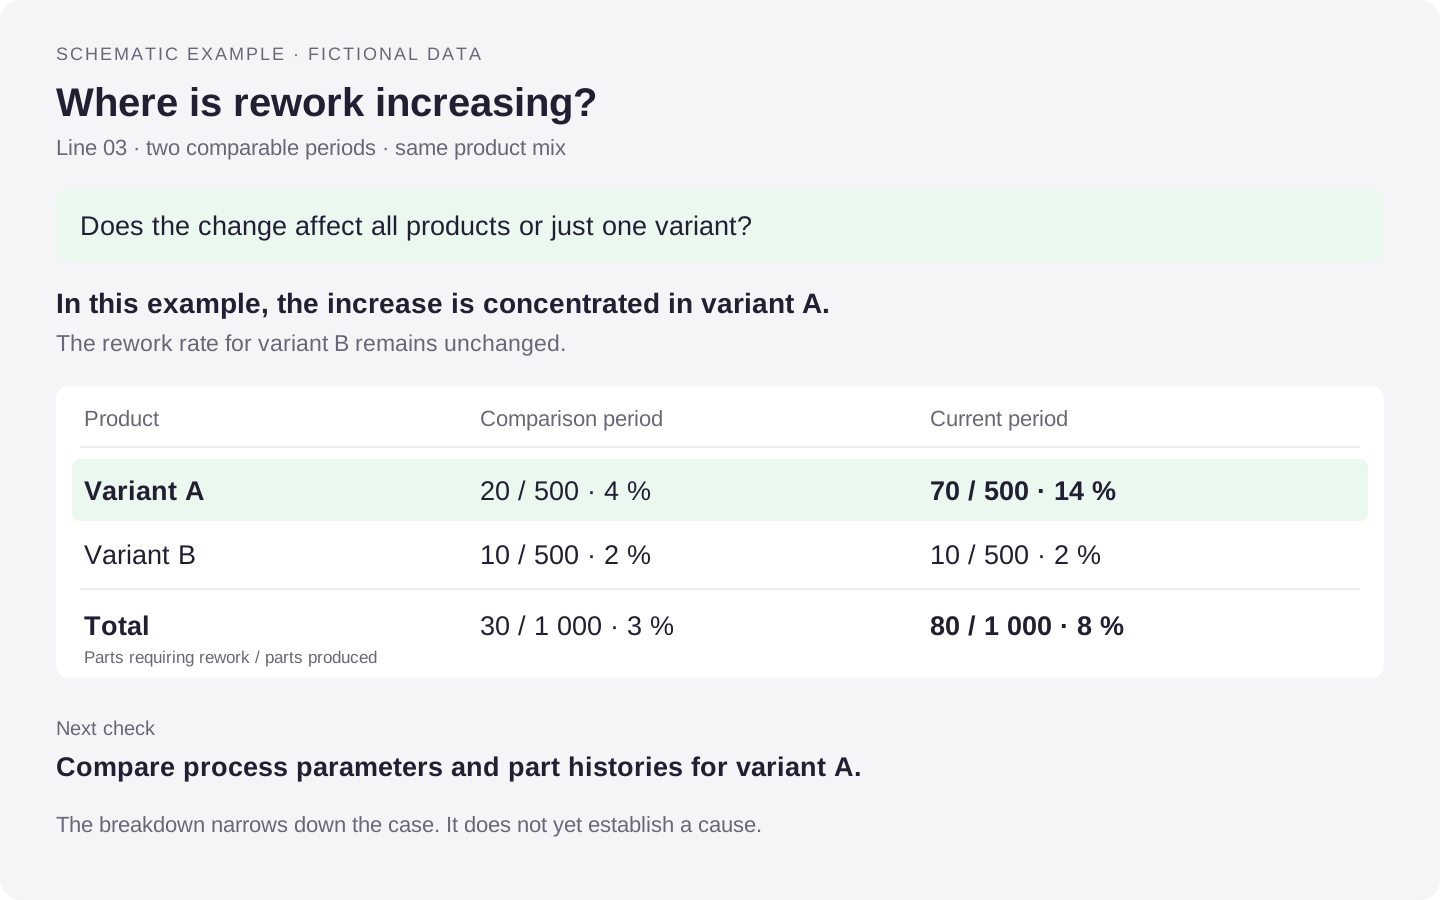
Our example line manufactures two product variants. In the comparison period, 30 out of 1,000 parts required rework. In the current period, that number is 80 out of 1,000. The rework rate has increased from 3 to 8 percent.
Before looking for a cause, we need to establish what the metric counts. In this example, each manufactured part is counted once. If it requires at least one rework operation, it contributes once to the rework rate. A part undergoing three rework steps does not count as three reworked parts. Scrap is considered separately.
The comparison itself also needs checking. Was data captured completely in both periods? Did the assessment at the test station change? Is the rework status already known for every part being considered? Mixing current quality notifications with production periods can allow parts from an earlier shift to change the metric.
These questions help establish whether we are investigating a change in production or first need to resolve a change in data collection.
Which product variant is affected?
The overall figure does not show where the additional rework occurs. We therefore break down manufactured parts and parts requiring rework by product variant.
| Product | Comparison period | Current period |
|---|---|---|
| Variant A | 20 of 500 parts · 4% | 70 of 500 parts · 14% |
| Variant B | 10 of 500 parts · 2% | 10 of 500 parts · 2% |
| Total | 30 of 1,000 parts · 3% | 80 of 1,000 parts · 8% |
The entire increase is concentrated in variant A. The rate for variant B has not changed. Both periods contain 500 parts of each variant, so a changing product mix does not explain the increase in this example.
The next question is more specific: what changed in the production of variant A?
Connect quality data with process data
The initial comparison requires the product variant, production period and rework status, all clearly linked to the part. Investigating causes requires additional information.
On an assembly line, that might include tools, workpiece carriers, material batches and measurements from individual processing and testing steps. For a tightening process, we might look at torque and angle. For a leak test, we examine the leakage value and the associated test conditions.
This information must belong to the relevant part and processing step. A PLC value read later might already refer to the next part. A timestamp alone is therefore not always enough to establish the relationship.
For variant A, we now investigate:
- Does the additional rework occur at a particular station?
- Are particular tools, workpiece carriers or material batches affected more often?
- Do process values differ between parts with and without rework?
- When does the behavior change? Does that time correspond to a tool change or an adjusted setting?
We compare rates alongside the underlying part counts. A tool producing more parts requiring rework is not necessarily unusual if it also processed substantially more parts overall.
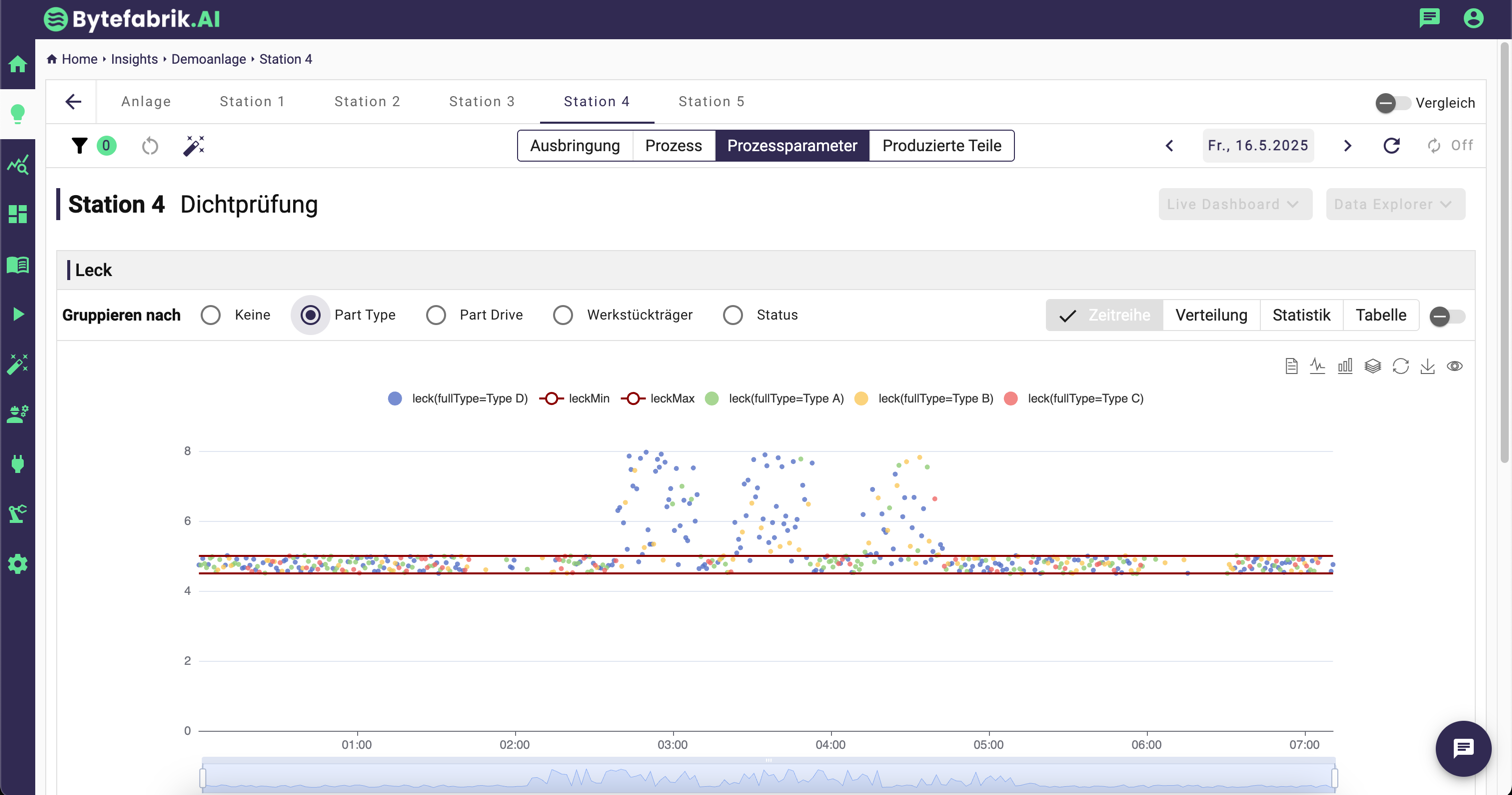
Production analysis in Manufacturing Insights connects quality values with the available station, product and process context. An unusual metric can then be investigated in relation to the production conditions behind it.
What work does AI handle?
The comparison by product variant does not initially require AI. Additional work arises when many machines need regular review or a question goes beyond the available standard analyses. The Copilot and AI Notebooks address different parts of this work.
The Copilot prepares a finding
The Manufacturing Analytics Copilot examines available data from the active Insights modules in the background. It can prepare an unusual development as a Data Story: which machine is affected, which period was considered and which data supports the finding?
In the rework example, the team starts with a prepared finding. A useful follow-up question in the chat is: “Does the increase affect all products or a particular variant?” The linked analysis views support further investigation.
The depth of the investigation depends on the available data. Quality counts can reveal a change, but they do not make missing tool assignments or unrecorded process parameters available to the Copilot.
An AI Notebook supports a custom analysis
For a more specific question, AI Notebooks in the IoT Data Hub can generate Python code from a description and analyze stored production data. A concrete question might be:
Compare leakage values for variant A between parts with and without rework. Group by workpiece carrier and period. Show the number of parts, median and distribution for each group. Report missing values separately.
The generated code and its results remain visible. The team checks that each part was assigned correctly, repeat tests were handled appropriately and filters match the investigation. A calculation that runs successfully can still compare the wrong groups.
AI supports the creation and refinement of the analysis. Process knowledge is still needed to assess the results.
Check the suspected cause on the machine
Suppose the next analysis shows elevated leakage values for variant A on a particular workpiece carrier. That gives the team a specific starting point. It does not prove that the carrier is responsible: perhaps it mainly processed a different material batch or used a different test recipe.
The team therefore checks the relevant part histories and actual conditions on the machine. Are the recipe, test parameters and material assignments correct? Is there a visible issue with the carrier? Can the suspected influence be confirmed under controlled conditions?
These checks provide the basis for a justified action. The analysis narrows down the search and identifies relevant cases. Technical verification remains the responsibility of the process owners.
Did the action reduce rework?
After a change, we evaluate variant A again. We use the same definition of the rework rate and compare similar production conditions. Part counts, product mix and other changes are considered as well.
A single good production run does not establish a lasting improvement. Alongside rework, we check whether scrap, cycle time or other quality characteristics have changed. This helps identify cases where a problem has merely moved elsewhere.
To evaluate the contribution of AI, we also record how much time the team spent finding and preparing the case. Which findings led to an investigation? Which could be confirmed? An improvement only follows when a finding leads to an effective action.
Start with a specific case
A line with recurring rework is a useful starting point. First, establish the metric, comparison period and available data. Then assess whether a standard analysis is sufficient, the Copilot can support regular review or an AI Notebook is needed for a custom question.
Are you investigating recurring rework or quality deviations? In a 30-minute demo on production problems, we use sample data to show how to narrow down a case. Together, we discuss which machine, process and quality data is relevant to your question. You do not need to prepare data for the demo.