Why Code Is the New No-Code for Machine Data Analytics
Manufacturing data is everywhere, but useful manufacturing analytics is still surprisingly hard. Most companies already collect machine data from PLCs, sensors, test stations, and production systems. The real problem starts one step later: turning this raw data into analyses that actually explain what is happening on the shop floor.
For years, the industry has tried to solve this with no-code tooling. That made sense: if engineers and process experts could model analyses without writing software, they could move faster and depend less on central IT teams.
But there is a catch. The more specific the production use case becomes, the more rigid most no-code approaches feel. And in manufacturing, use cases are almost always specific.
Why machine data is difficult to analyze
Analytics on industrial data is not a single problem. It is a large collection of very different questions, for example:
- What machine states occur most often and how long do they last?
- Which alarms have the biggest impact on downtime?
- How stable is output over time?
- Where do cycle time and takt time deviate from the baseline?
- How can we trace a product across multiple stations and process steps?
These questions sound straightforward, but the underlying data usually is not. PLC data is primarily designed for machine control, not for later analysis. Signals are named from an automation perspective, events may be distributed across different structures, and the business meaning often only emerges when multiple data points are combined.
In other words: the data exists, but it is rarely analytics-ready.
This creates two recurring challenges:
- Understanding the data model: users need to know which tags, events, and structures are relevant for a given use case.
- Harmonizing the data: raw machine signals often need to be transformed into a more meaningful analytical representation before any KPI or chart becomes useful.
That is exactly why manufacturing analytics has traditionally required either custom software projects or highly specialized internal teams.
The promise and limitation of no-code
Self-service analytics became popular because custom-built solutions do not scale well. They are expensive, slow to adapt, and difficult to maintain when production processes change.
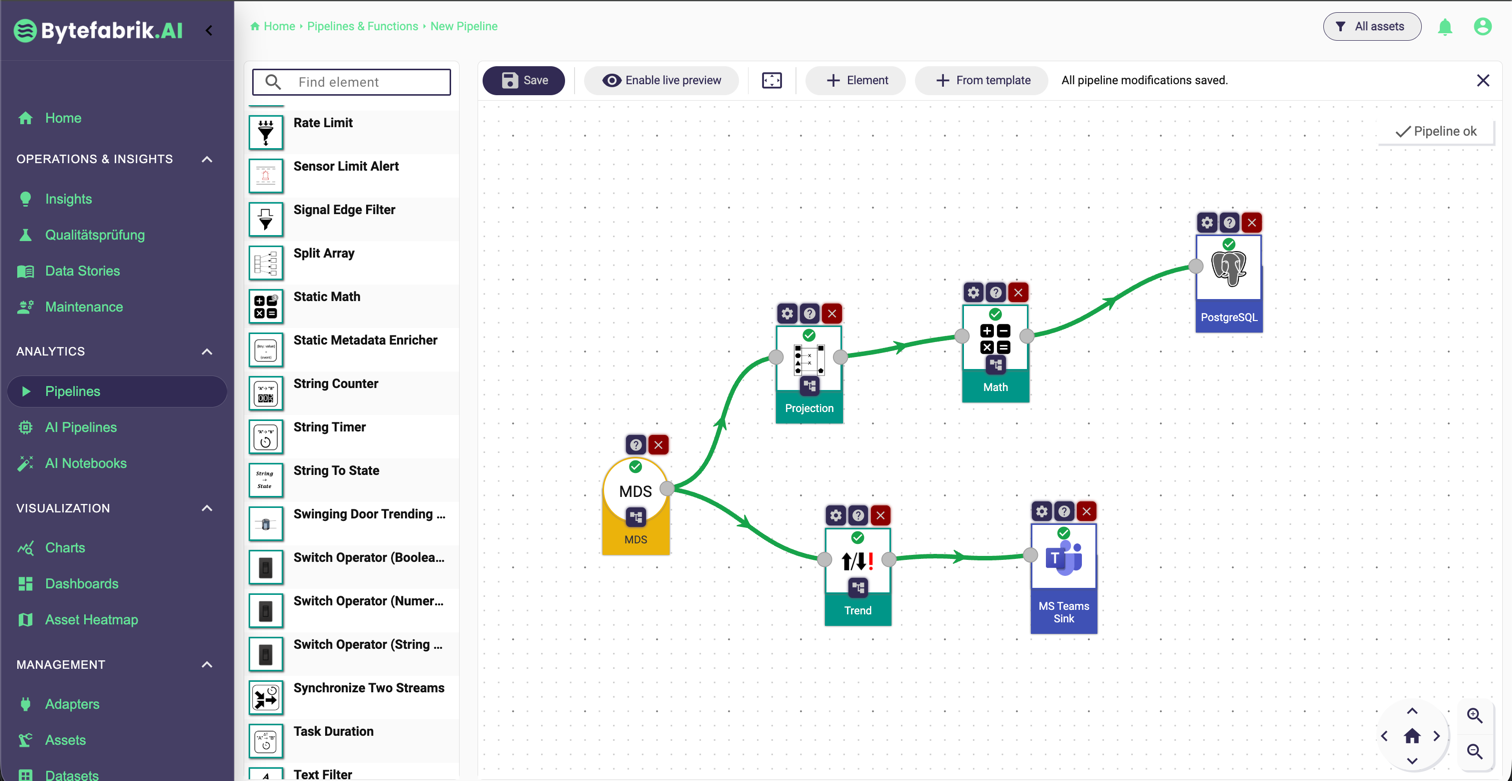
No-code and low-code tools improved this situation significantly. Graphical pipelines, drag-and-drop rules, and reusable processing blocks made it possible to assemble analytics logic much faster. Platforms such as Node-RED and also the pipeline editor of Bytefabrik.AI show that many streaming and event-based use cases can be modeled effectively without starting from a blank code editor.
This was a major step forward. Prebuilt blocks for filtering, aggregations, threshold checks, or trend detection lower the entry barrier and make recurring tasks easy.
Still, the trade-off remained visible:
- graphical models are easy to start with, but can become hard to maintain when logic grows;
- highly specialized use cases often require custom behavior outside the available building blocks;
- flexibility and ease of use often move in opposite directions.
That trade-off shaped industrial analytics for a long time.
Why code is becoming the new no-code
Large Language Models and AI agents change this equation fundamentally.
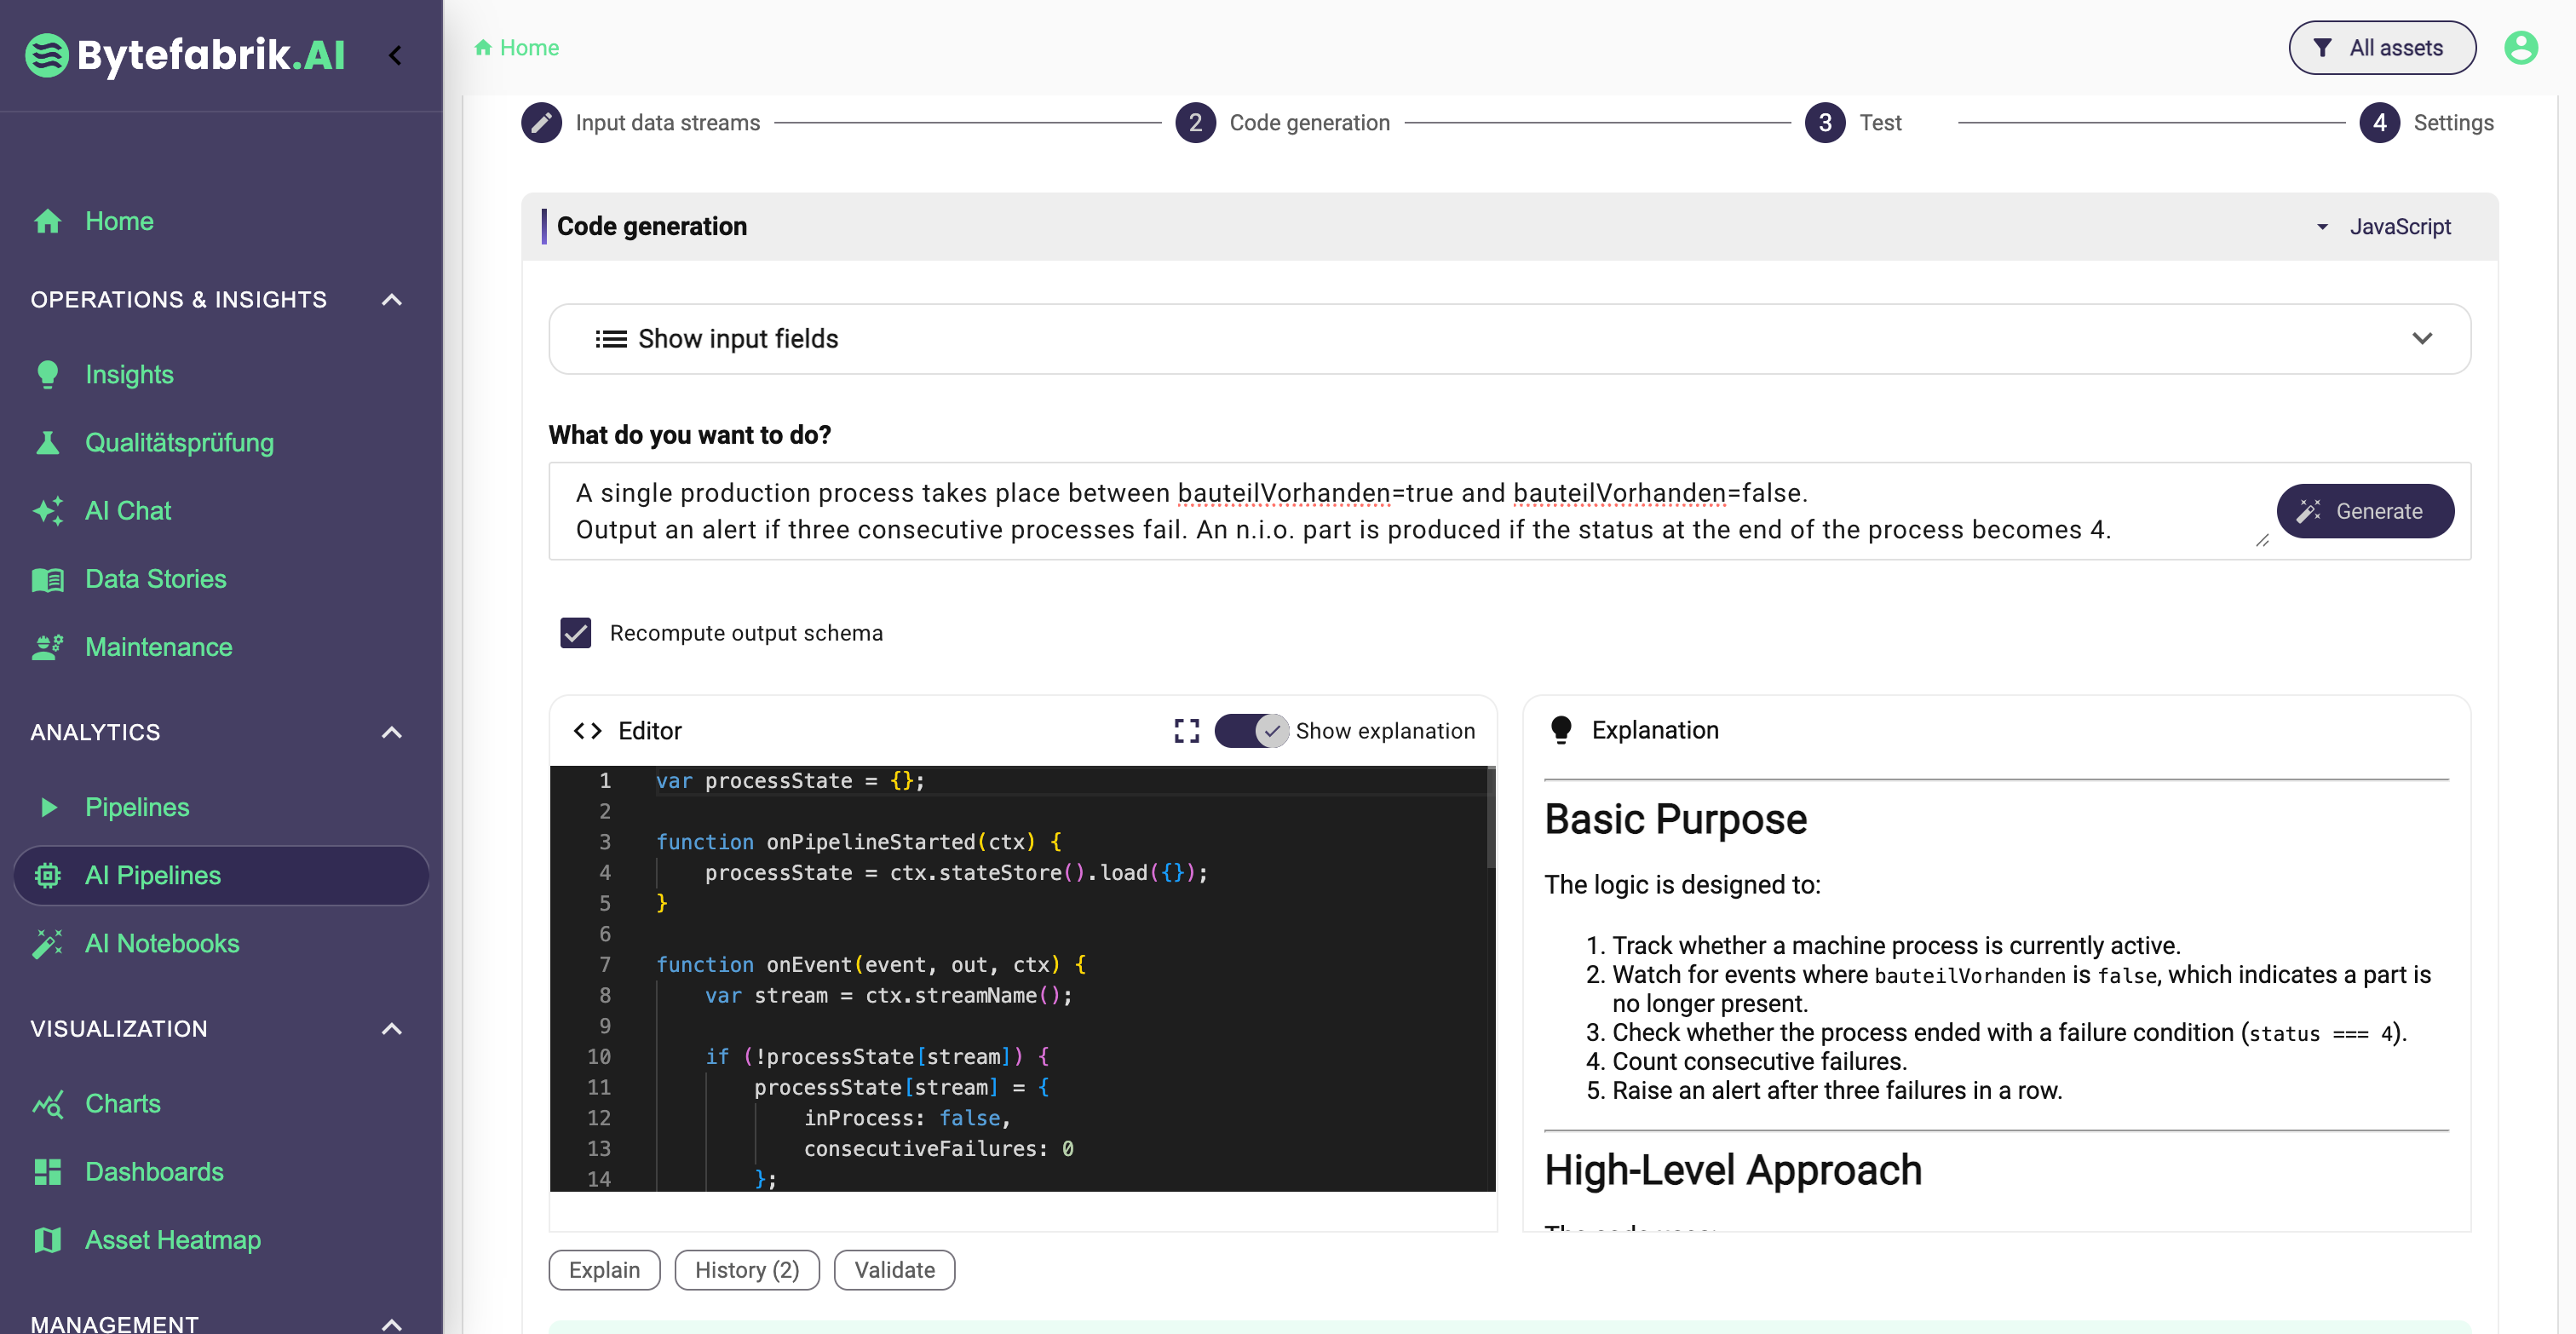
For the first time, non-programmers can describe an analytical goal in natural language and receive usable code as a starting point. The important shift is not just that code can be generated. It is that code can now be generated, explained, tested, refined, and iteratively improved in a way that is practical for domain experts.
This matters because code has always been the most flexible interface for data analysis. With code, there is no need to wait for the next visual block type or a product feature request. Users can express exactly the transformation, correlation, or metric they need.
Until recently, that flexibility came with a clear cost: programming skills. Now that cost is much lower.
AI-assisted development introduces a new workflow:
- A domain expert describes the use case in plain language.
- The system generates the analysis logic as code.
- Users can receive explanations of the generated code according to their own level of technical and domain expertise.
- The system generates test data cases to ensure the generated code fits the purpose.
- The generated code is executed on real machine data, either on-the-fly as data stream processor, or on historical data.
- The result is reviewed and refined in an iterative loop.
- The result is used in a dashboard, in a report, or continuously sent to third-party systems like notification systems or databases.
This is why code is becoming the new no-code. Users still work at a high level of abstraction, but the execution model underneath is no longer a closed visual system. It is open, expressive, and adaptable.
For industrial analytics, this is especially powerful because production data is rarely standardized enough for one-size-fits-all solutions. AI-generated code fits much better to the variability of real machines, real processes, and real operational questions.
A concrete example: building an alarm log from OPC UA events
Consider a typical alarm analysis use case. A company wants to understand which alarms cause the most disruption in a production line. The raw source is an OPC UA event stream emitted by machines or stations.
At first glance, this sounds simple: collect alarms and count them. In practice, the structure is richer and more challenging.
OPC UA events often include information such as:
- the event time;
- the source node or source name;
- the message text;
- the severity;
- active or inactive status;
- acknowledgment or confirmation status;
- additional fields depending on the event type.
To make this useful for production analytics, the event stream usually has to be transformed into an alarm log with a business-oriented schema, for example:
errorIdstartTimeendTimedurationseverityimpactassetorstation
Already that initial transformation is where projects often get stuck. You need logic that recognizes which events belong together, when an alarm starts, when it ends, how repeated events are merged, and how severity is translated into operational impact. And once another machines does not use OPC UA events, but provides its custom model (e.g., by representing errors as bit arrays), there is a lot of effort do bring heterogeneous raw data into a standardized structure.
This is exactly the kind of task where AI-assisted code generation is stronger than fixed no-code blocks. A user can describe the desired alarm model in natural language, have the transformation logic generated automatically, and then refine details such as grouping rules, duration calculation, or impact scoring.
Once the alarm log exists, the downstream analysis becomes much easier:
- Which alarms create the most downtime?
- Which stations have the highest alarm frequency?
- Are there alarms that always occur before a quality issue?
- Which alarms are noisy, and which ones are operationally critical?
The difficult part is not drawing the dashboard, it is creating the right analytical representation from raw machine events and the derived alarm log.
From fixed tooling to iterative analytics
Another important shift is that AI does not only generate code once. It can support an iterative analysis loop.
If the first result is incomplete, the user can ask follow-up questions:
- "Split the alarm durations by station."
- "Ignore maintenance mode."
- "Correlate high-severity alarms with rejected parts."
- "Show only alarms that occur within 30 seconds before a stop."
This workflow is much closer to how real analytical work happens. Insights usually do not appear after a single dashboard configuration. They emerge through refinement, reframing, and repeated testing of assumptions.
That is why AI-guided code-based analytics feels so natural in manufacturing. The user does not need to think in terms of software implementation first. They can think in terms of process behavior, machine events, and operational questions.
How we approach this at Bytefabrik
At Bytefabrik, we use this idea in two complementary ways.
AI Pipelines are designed for live and operational scenarios. They help users define alerting rules, event-based logic, and on-the-fly analytics on streaming IoT data. Instead of limiting users to a fixed set of building blocks, AI can generate the code needed for more specialized transformations and evaluations.
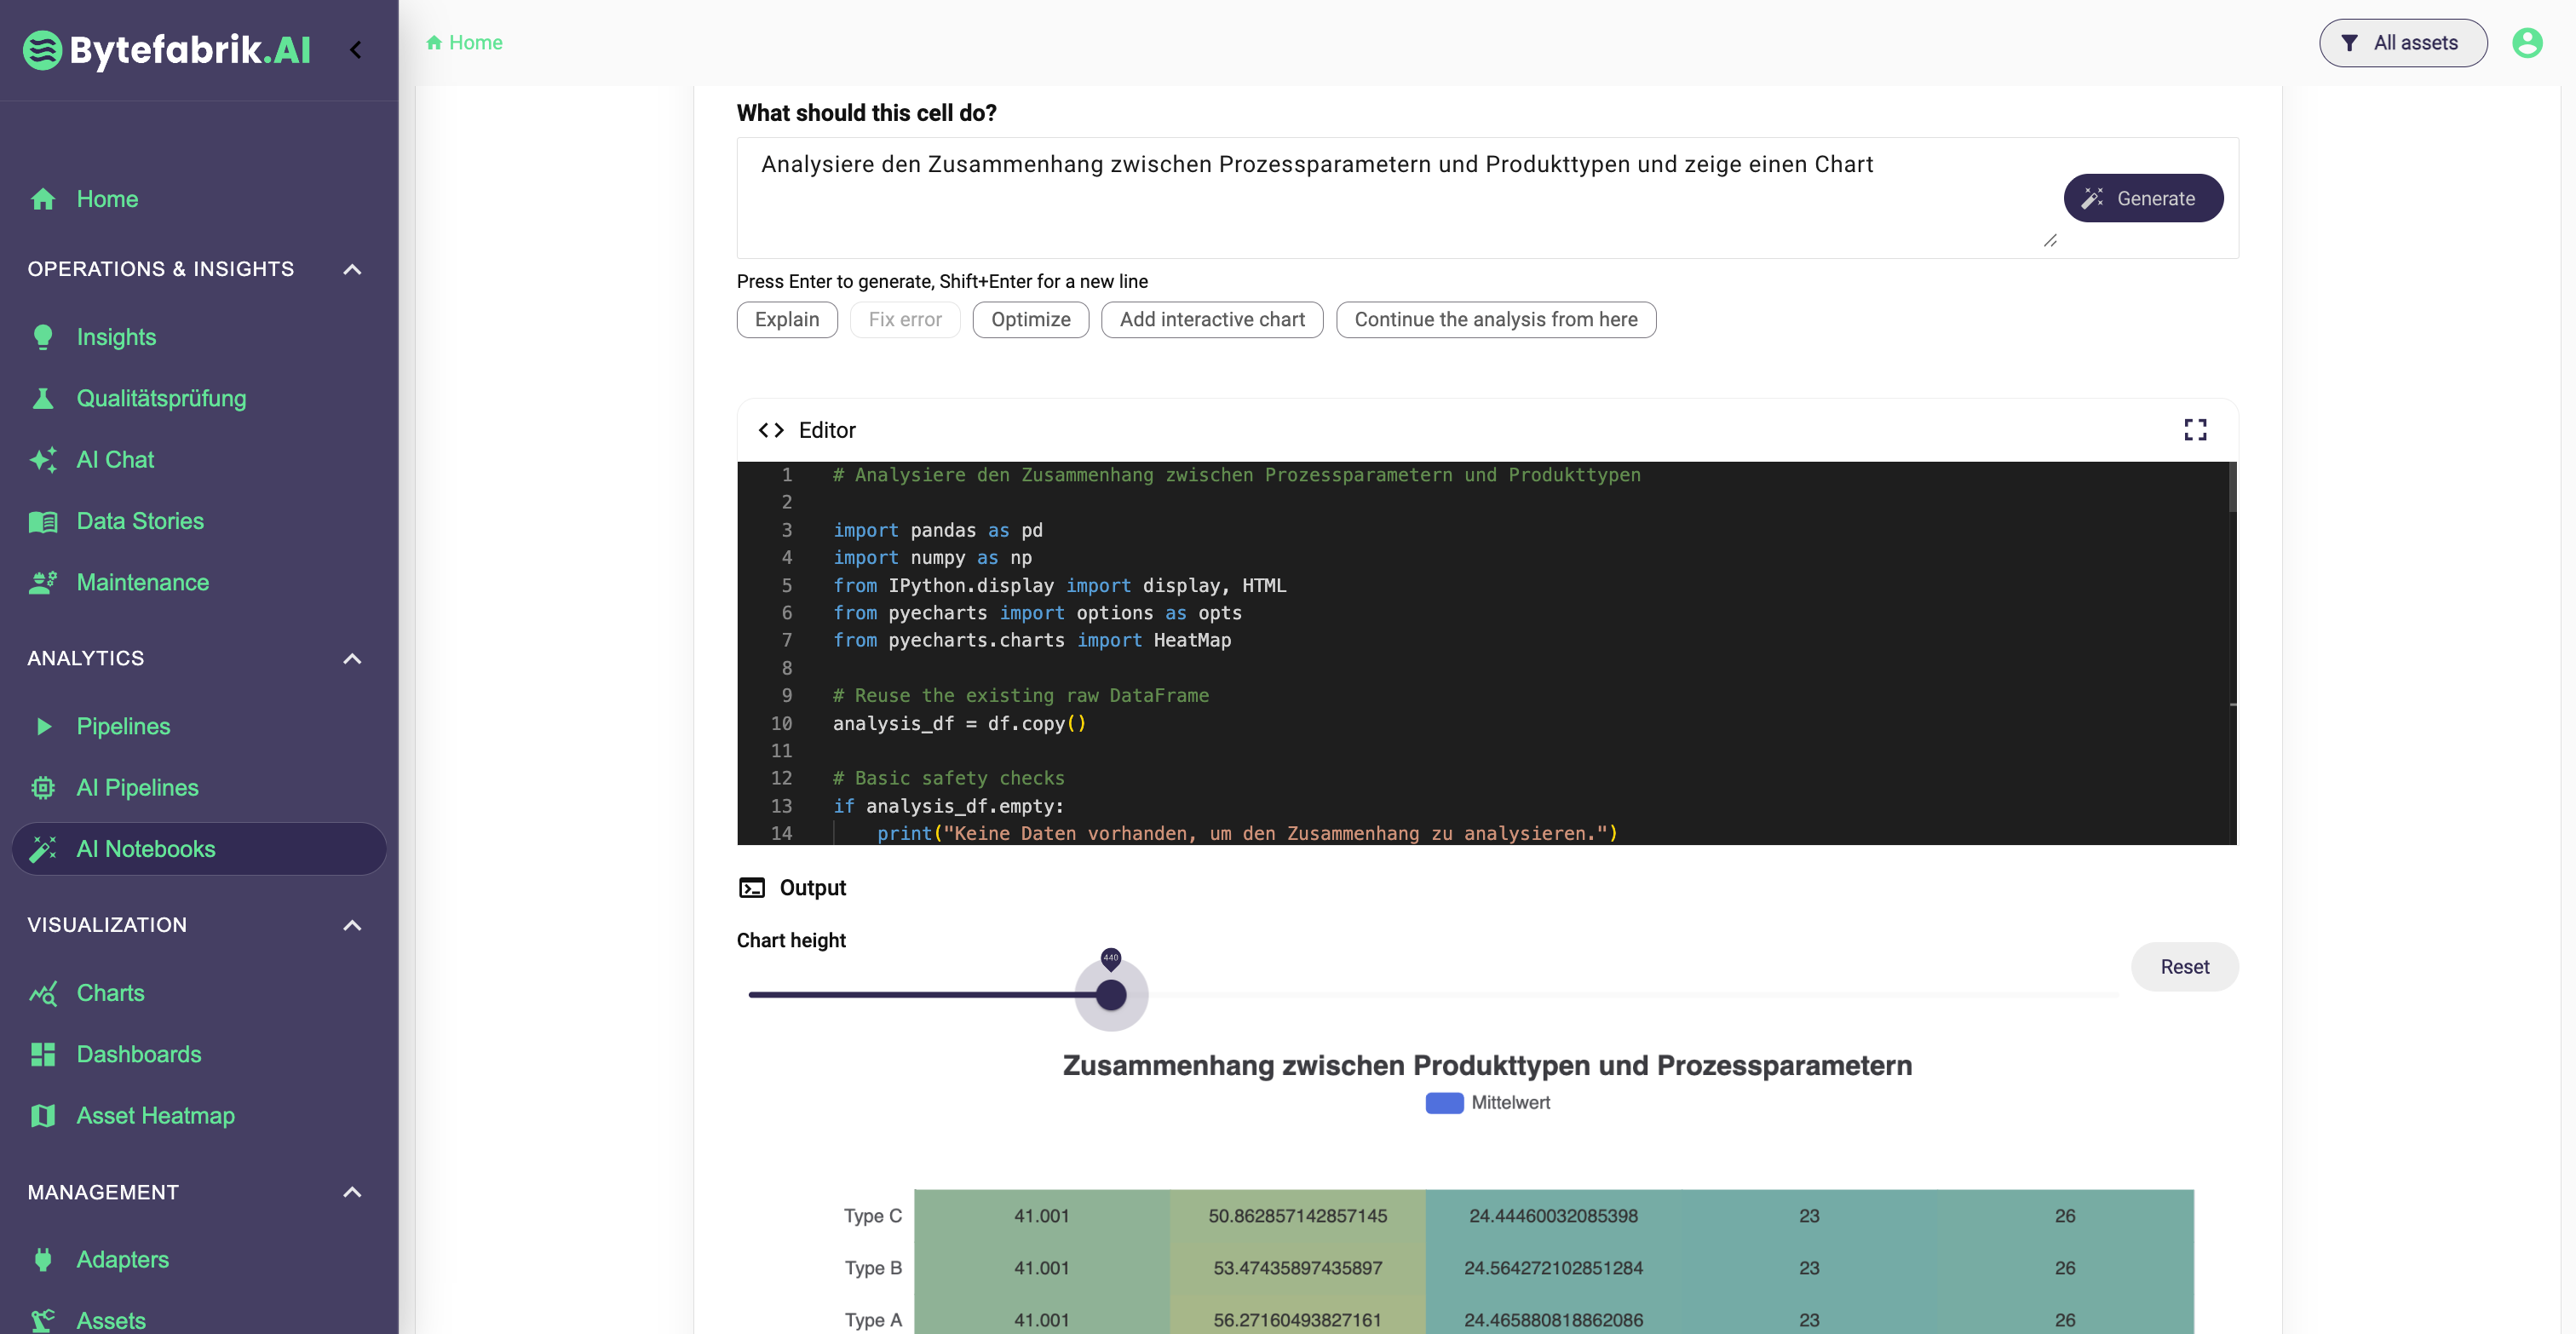
AI Notebooks focus on historical analysis. They combine native Python support (where we benefit from the existing open Python client that interacts with our core platform), AI-assisted code generation, and interactive visualization components so that users can explore production data in a flexible and reproducible way. This is particularly useful for deeper investigations such as root-cause analysis, quality analysis, trend evaluation, or alarm mining.
In both tools, we have integrated sophisticated AI methods to ensure the generated code is correct and can be understood and executed.
Together, these two approaches cover both sides of industrial analytics:
- immediate operational reactions on live data;
- deeper analytical work on historical machine and production data.
The bigger picture
Democratizing machine data analytics does not mean removing all technical depth. It means making that depth accessible when needed, without forcing every user to become a professional software developer.
In the past, no-code tools democratized access by hiding code. Today, AI democratizes access by making code usable.
That is a subtle but important difference. It preserves flexibility instead of replacing it with abstraction. And for industrial environments, where every production process has its own logic, that flexibility is often the difference between a nice demo and a system that creates real operational value.
Machine data analytics is entering a new phase. The winning platforms will not be the ones that offer the most blocks. They will be the ones that let domain experts move from raw machine events to meaningful insights with the least friction and the highest degree of control.
If you want to see how AI Pipelines and AI Notebooks make this possible in practice, take a look at our AI Notebooks, AI Pipelines, or schedule a demo.